112 Pregnancy Statistics (2026): Births, Symptoms & Safety
Updated September 16, 2026
Find U.S. pregnancy statistics on births, maternal health and fertility, alongside findings on product checks and reported symptoms in the Pregnancy Safe app. Browse by topic, follow the original sources and download charts for your article or report.
No matching statistics. Try a broader term or clear your search.
Pregnancy and birth totals
U.S. live births
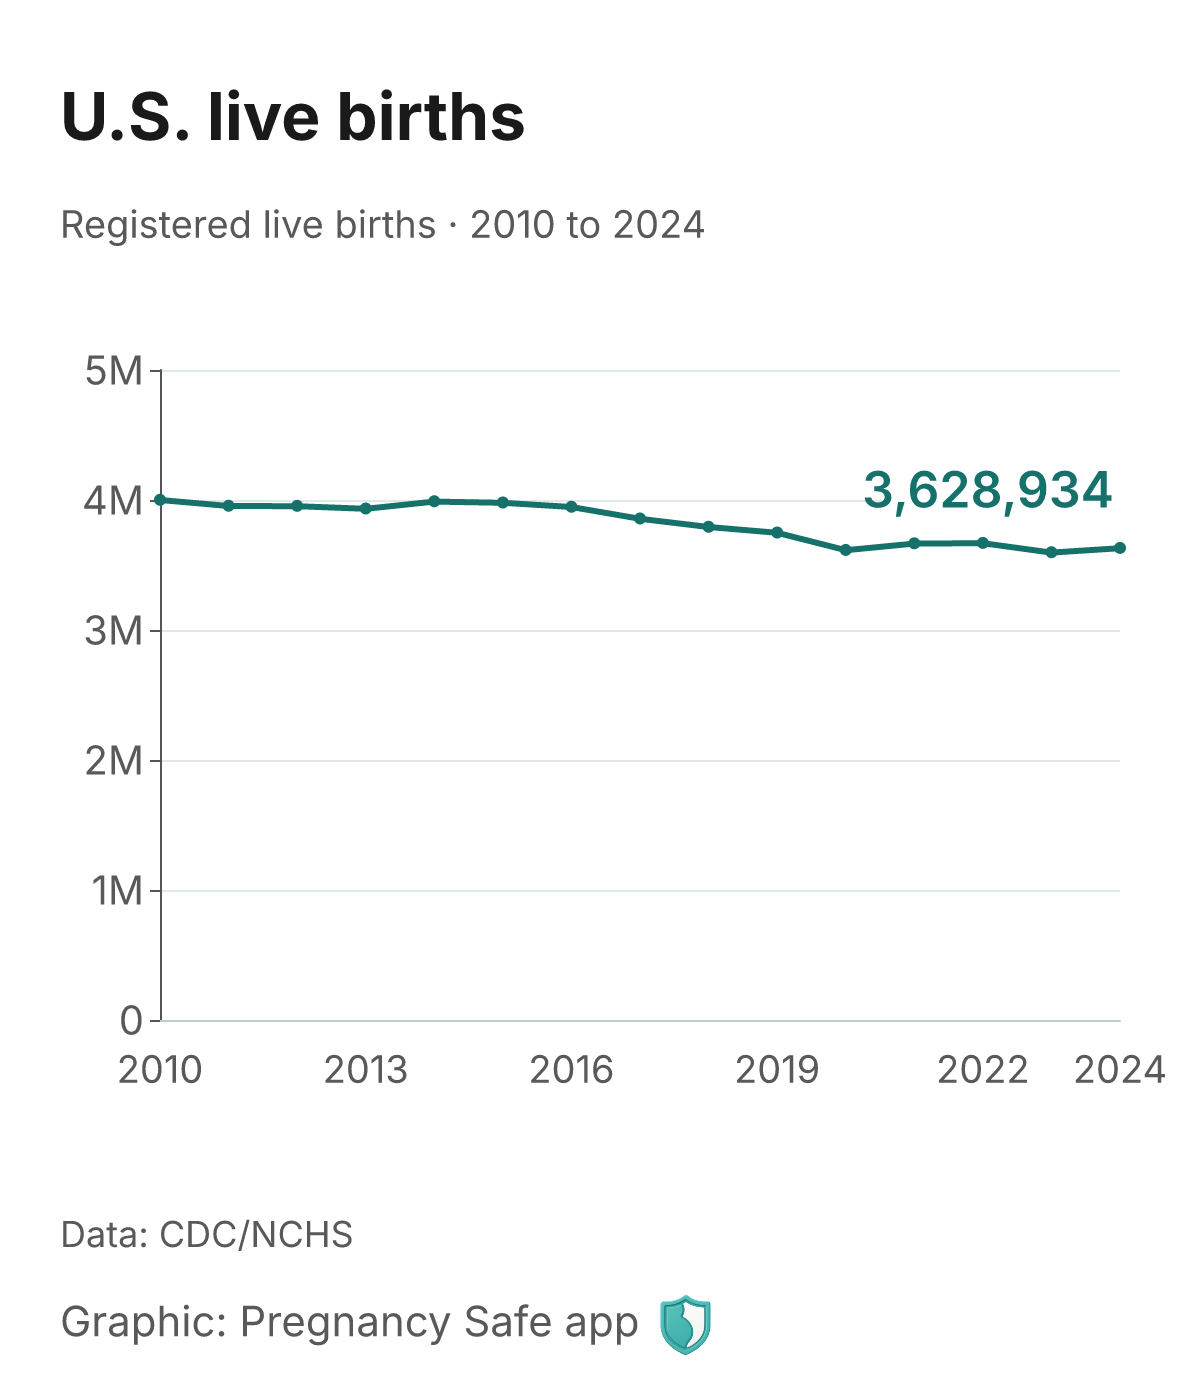
CDC/NCHS recorded 3,628,934 U.S. live births in 2024, compared with 3,596,017 in 2023.
Source: CDC, National Center for Health Statistics (NCHS)
Download imageU.S. teen birth rate
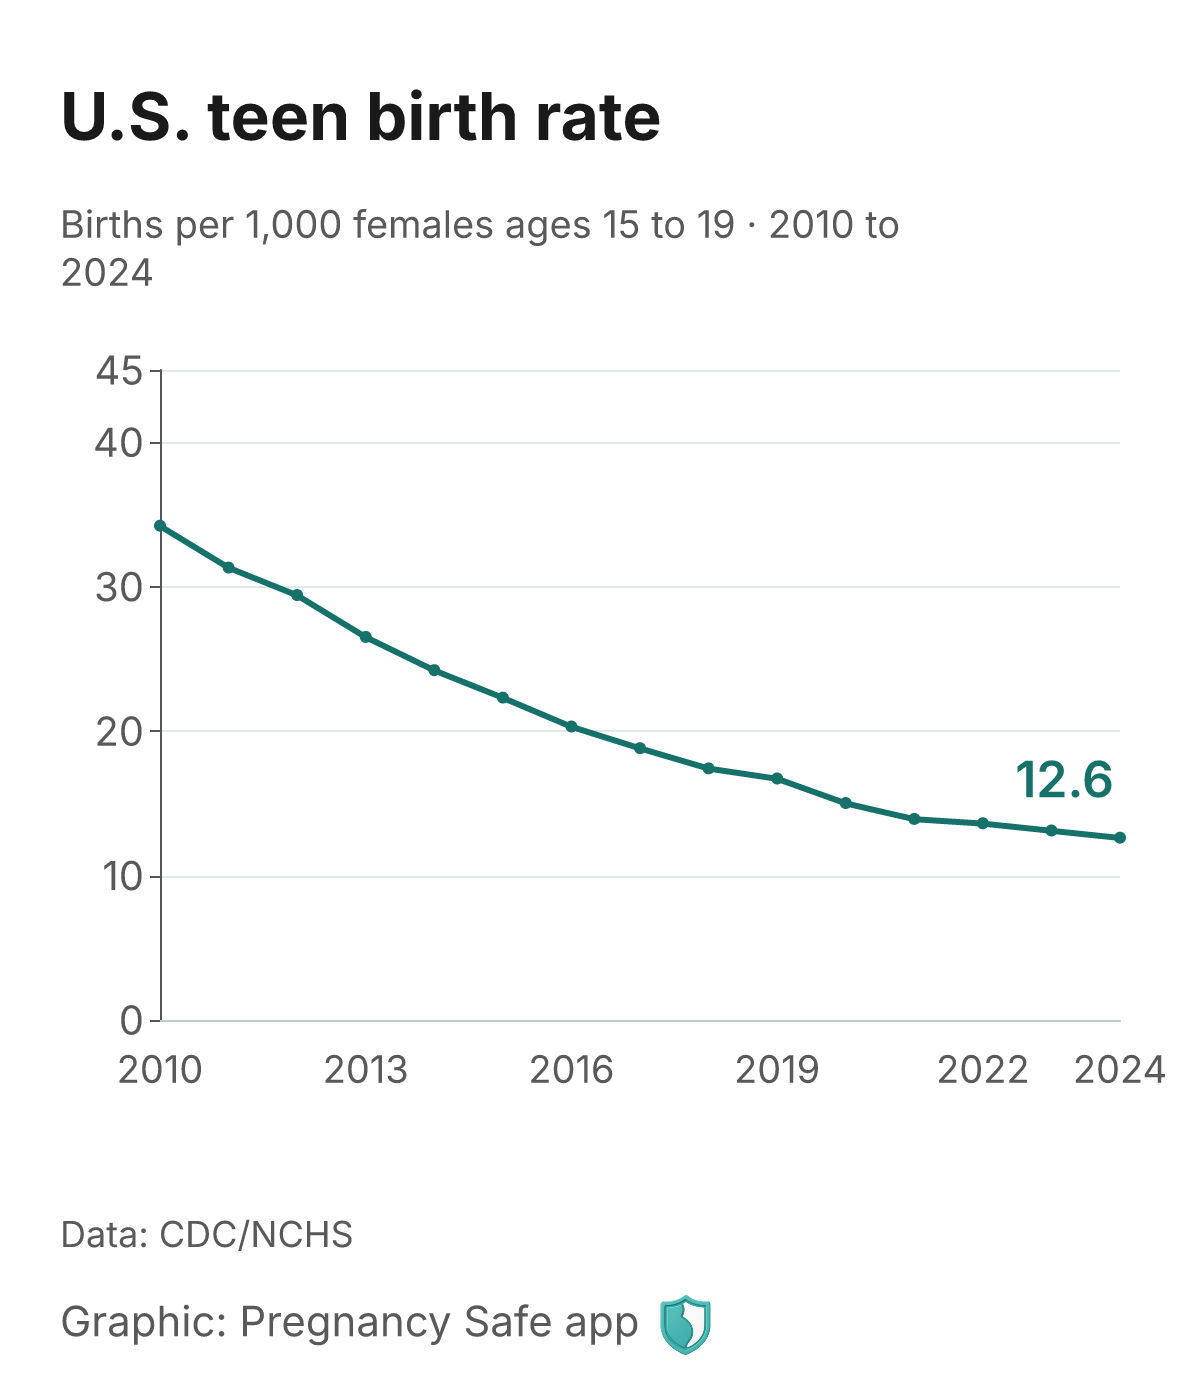
In 2024, the U.S. birth rate for females ages 15 to 19 was 12.6 live births per 1,000 females in that age group.
Source: CDC, National Center for Health Statistics (NCHS)
Download imageEstimated U.S. pregnancies
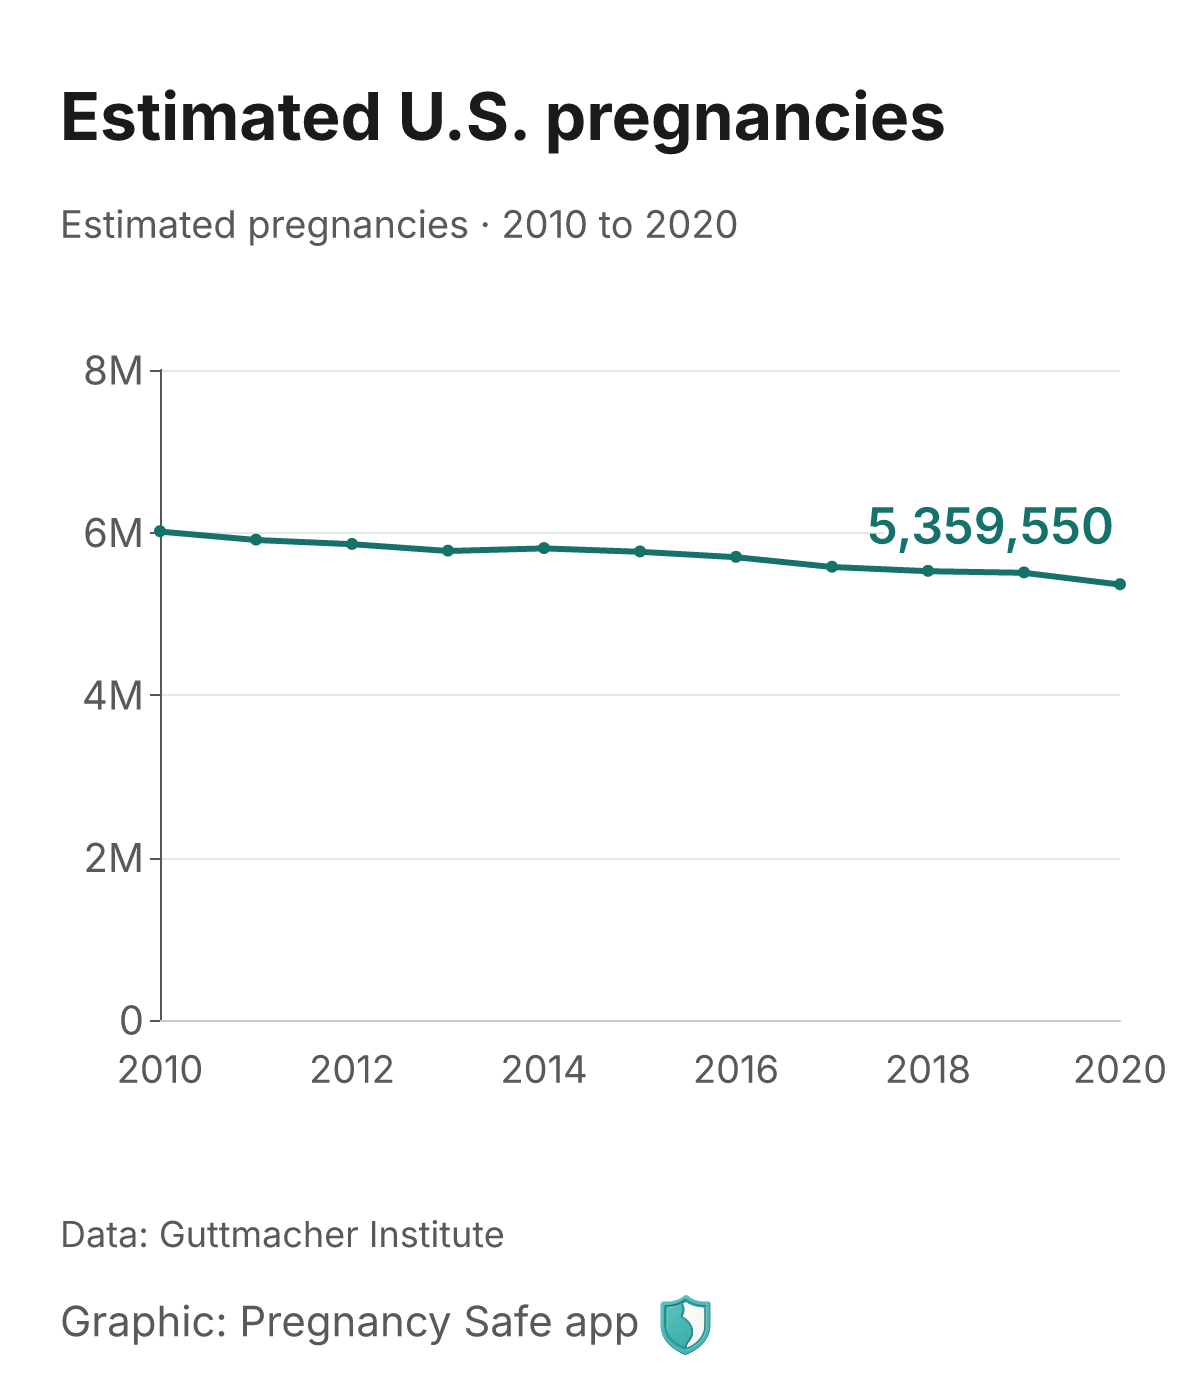
Guttmacher estimated 5,359,550 U.S. pregnancies in 2020, including estimated fetal losses.
Source: Guttmacher Institute
Download imageU.S. pregnancy rates by age
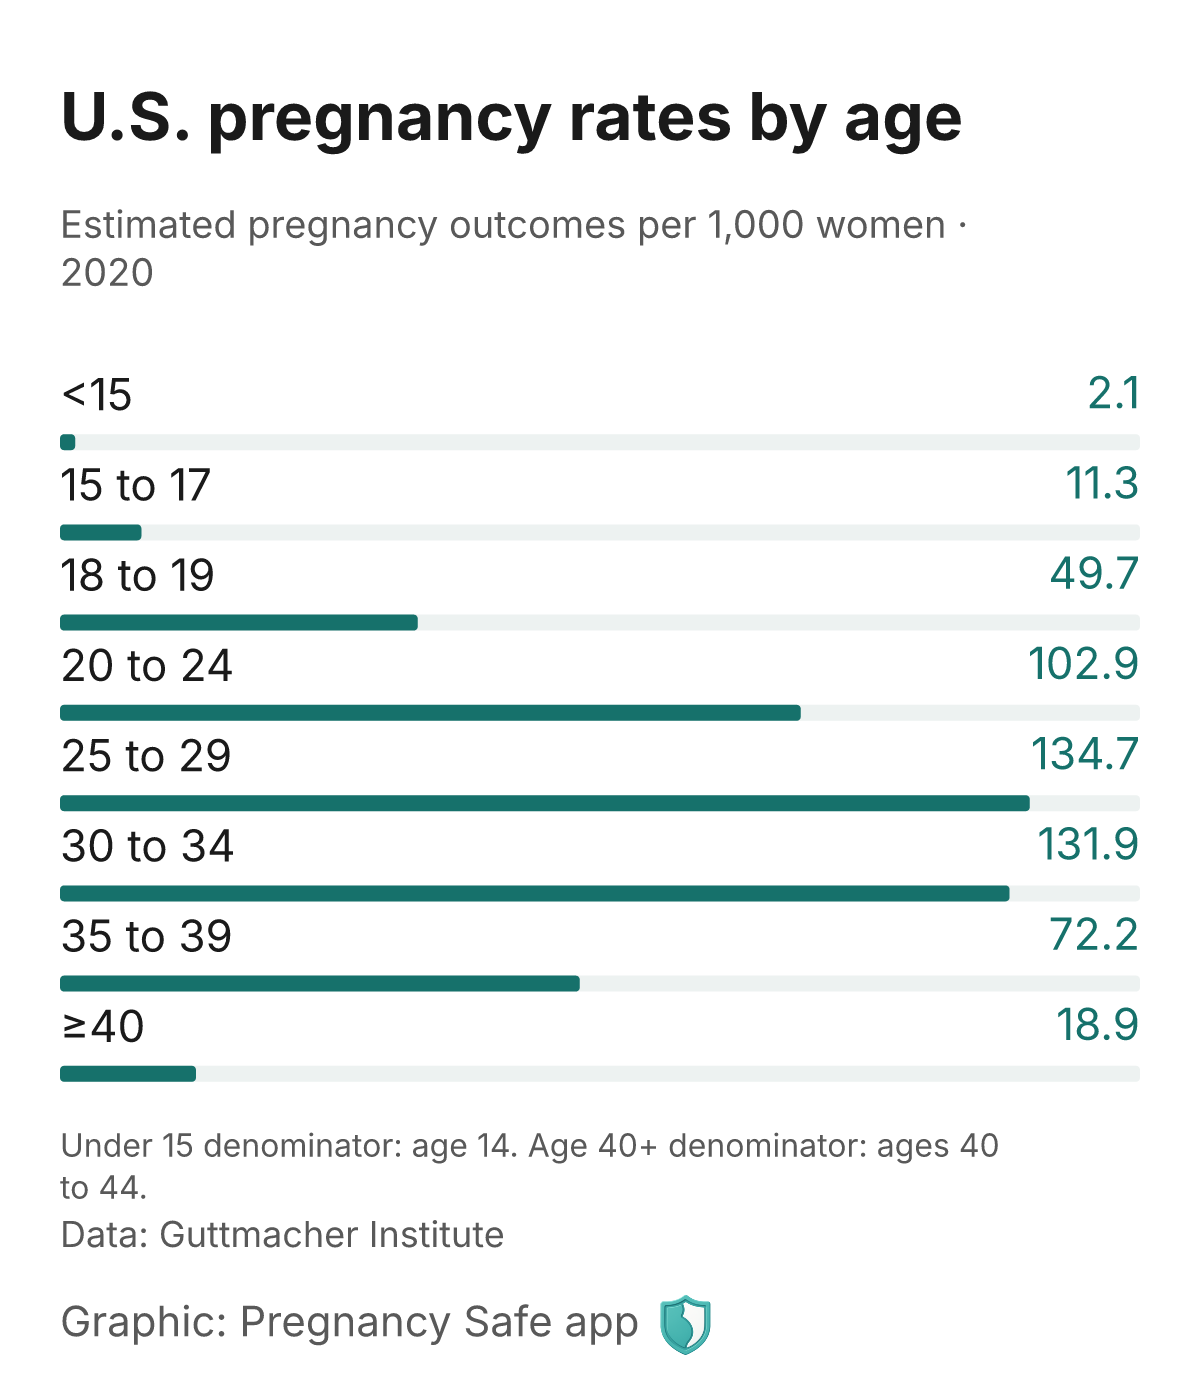
In Guttmacher’s 2020 estimates, ages 25 to 29 had the highest pregnancy rate among the listed age groups: 134.7 per 1,000 women.
Source: Guttmacher Institute
Download imageUnintended pregnancies in the U.S.
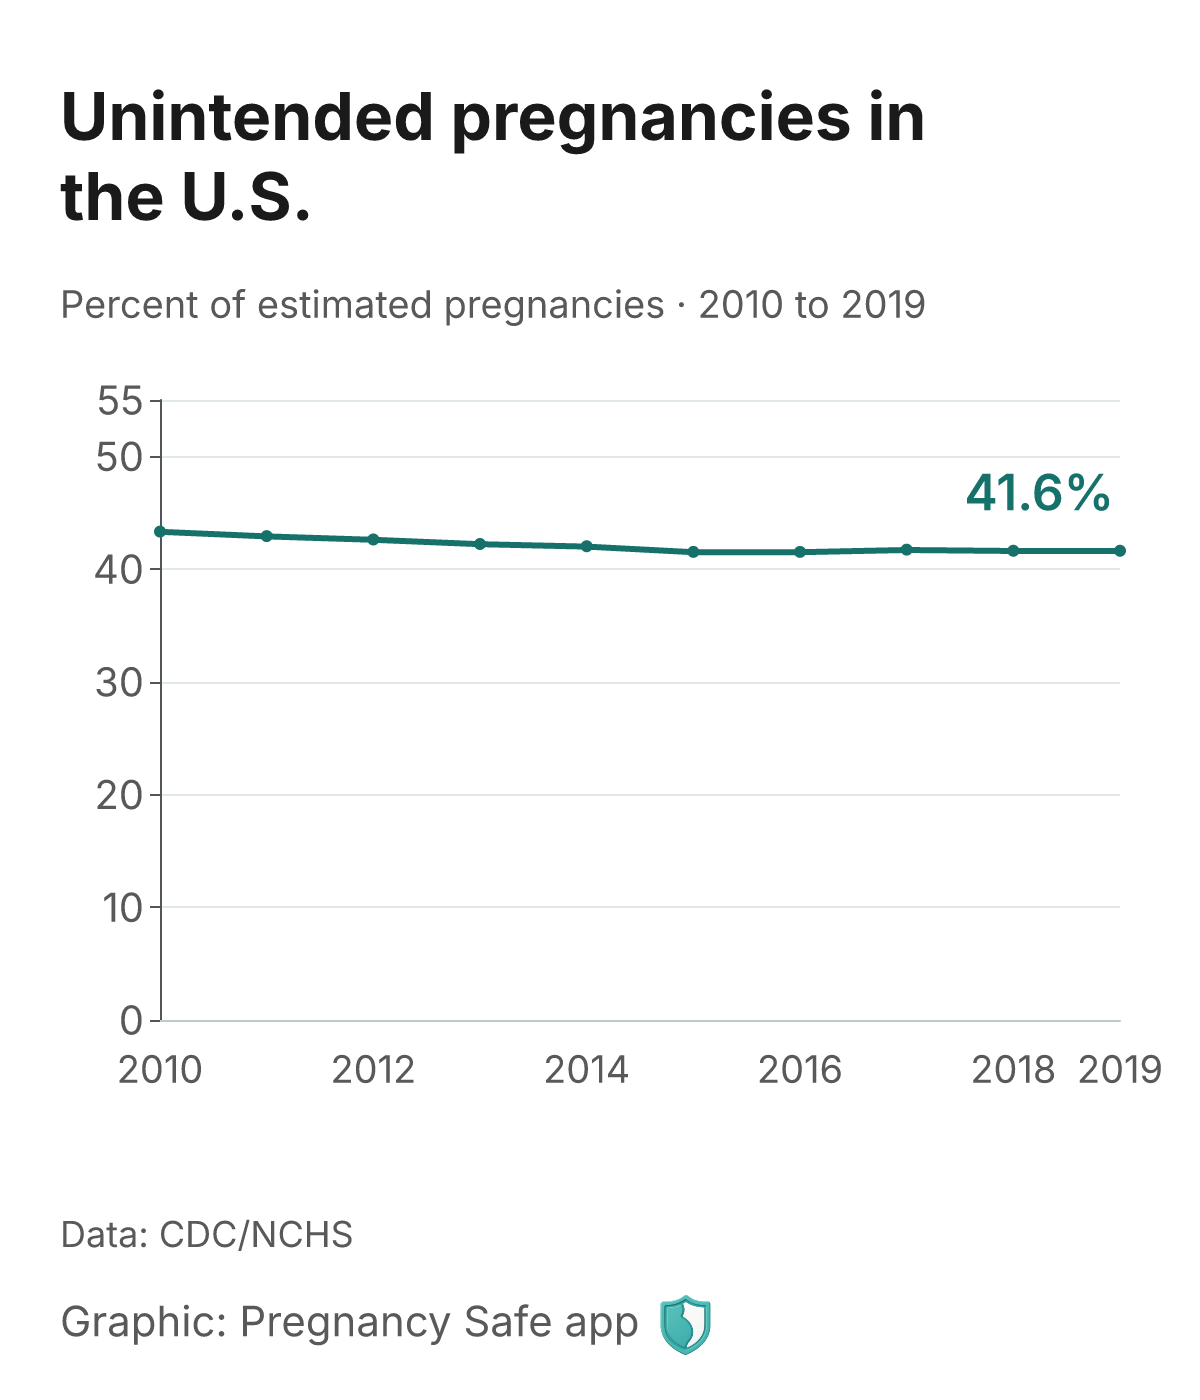
NCHS estimated that 41.6% of U.S. pregnancies were unintended at conception in 2019, compared with 43.3% in 2010.
Source: CDC/NCHS
Download imageU.S. unintended pregnancy rate
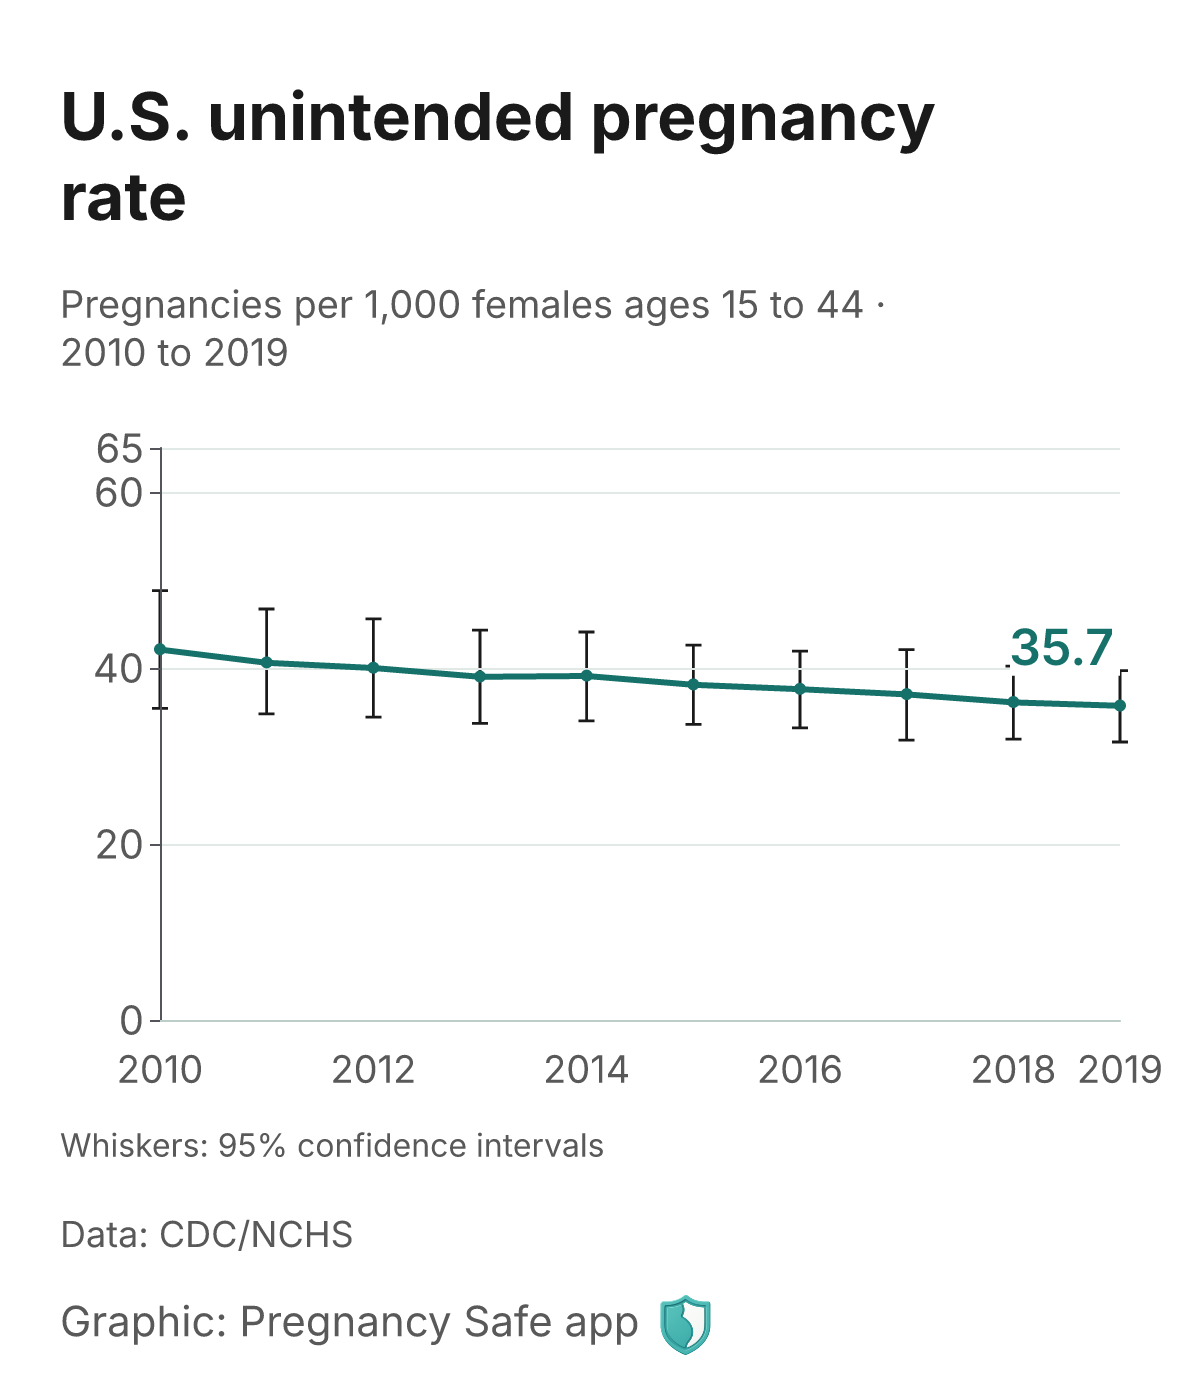
NCHS estimated 35.7 unintended pregnancies per 1,000 females ages 15 to 44 in 2019 (95% CI 31.6 to 39.7).
Source: CDC/NCHS
Download imageU.S. mean age at first birth
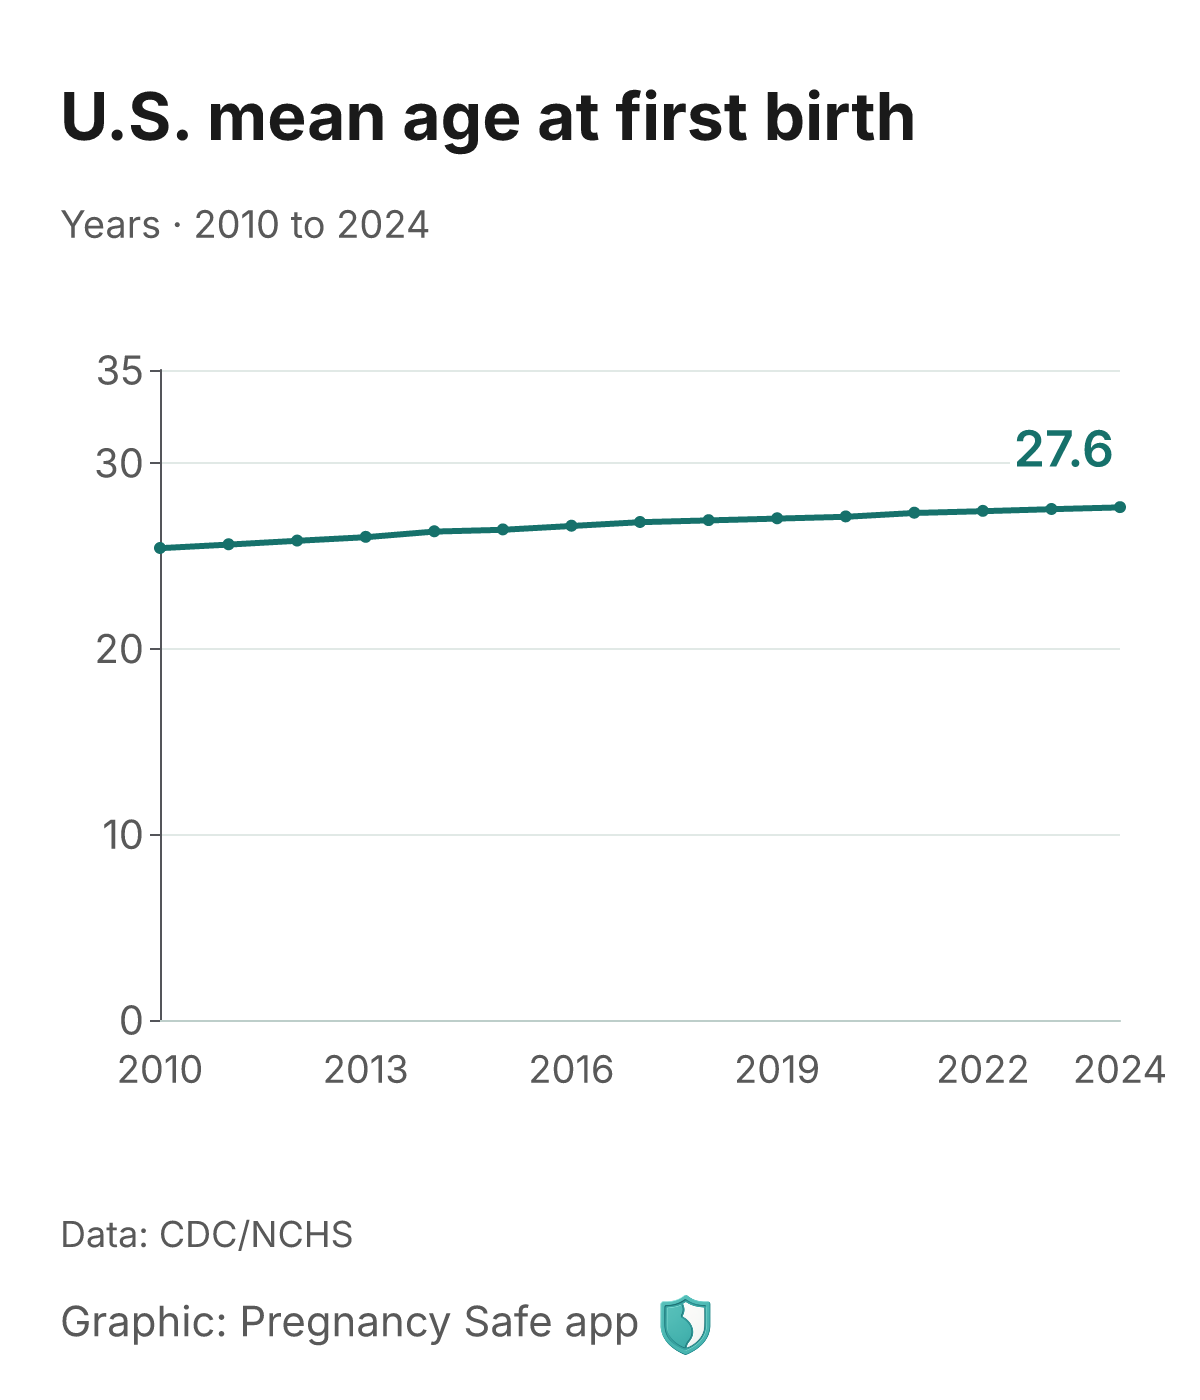
The mean age of U.S. mothers at their first live birth was 27.6 years in 2024, compared with 25.4 in 2010.
Source: CDC, National Center for Health Statistics (NCHS)
Download imageU.S. birth rates by age
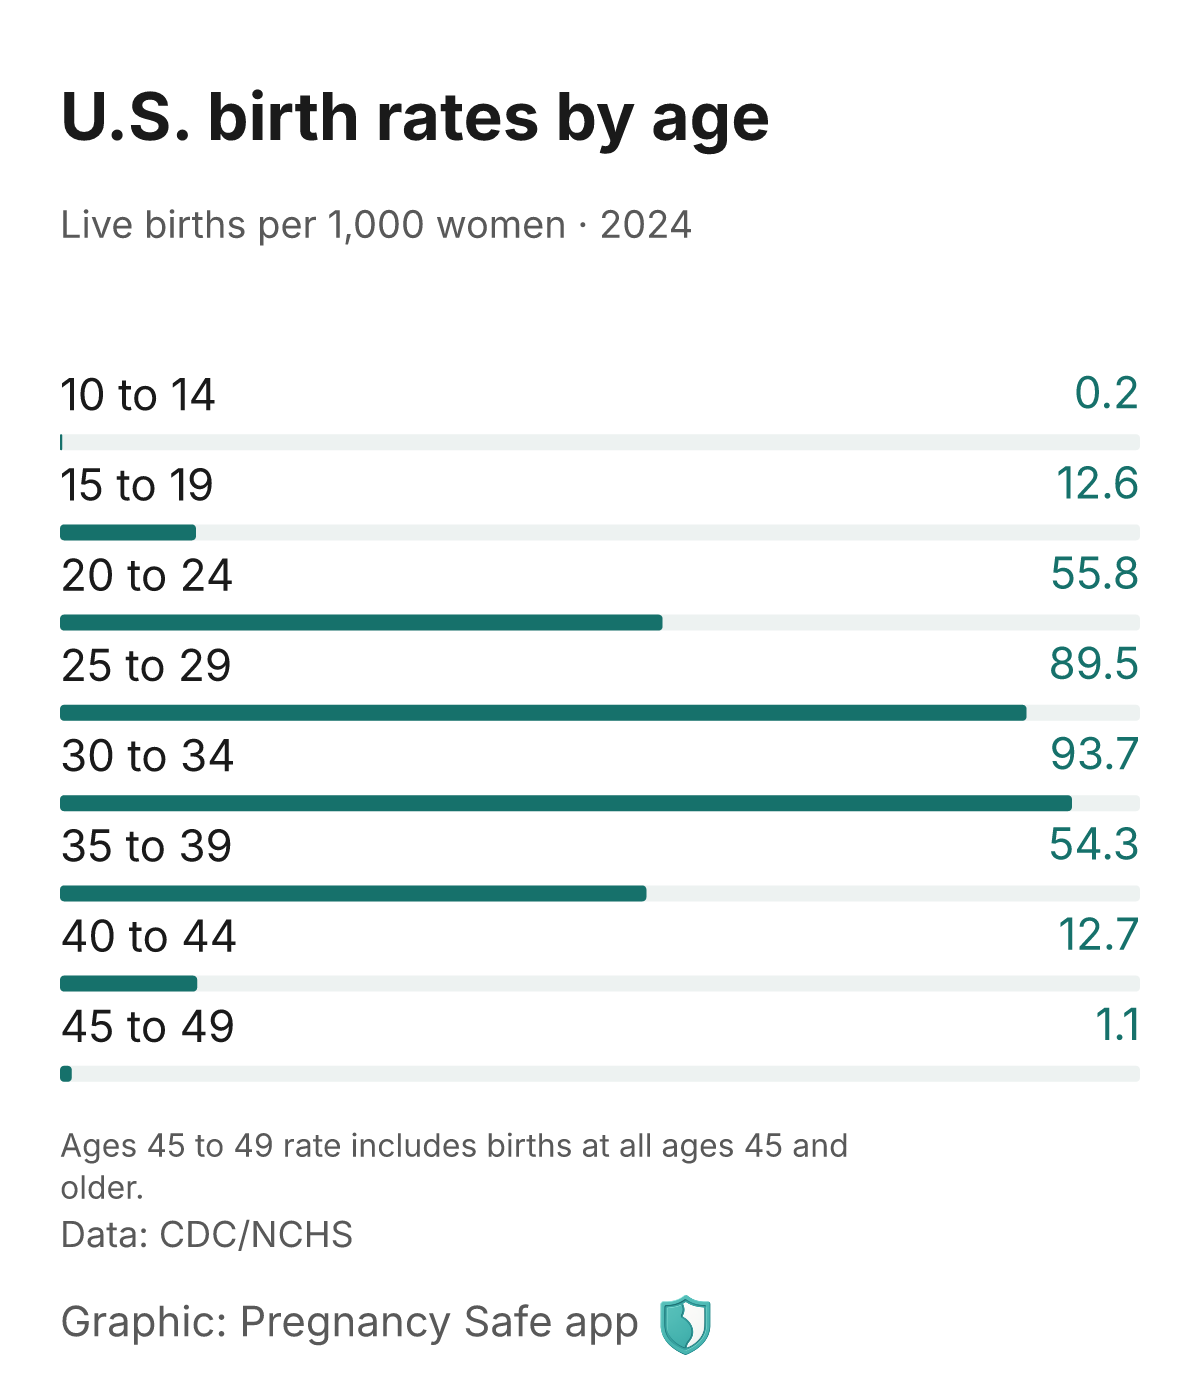
The highest listed U.S. age specific birth rate in 2024 was among women ages 30 to 34: 93.7 live births per 1,000 women.
Source: CDC, National Center for Health Statistics (NCHS)
Download imageU.S. total fertility rate
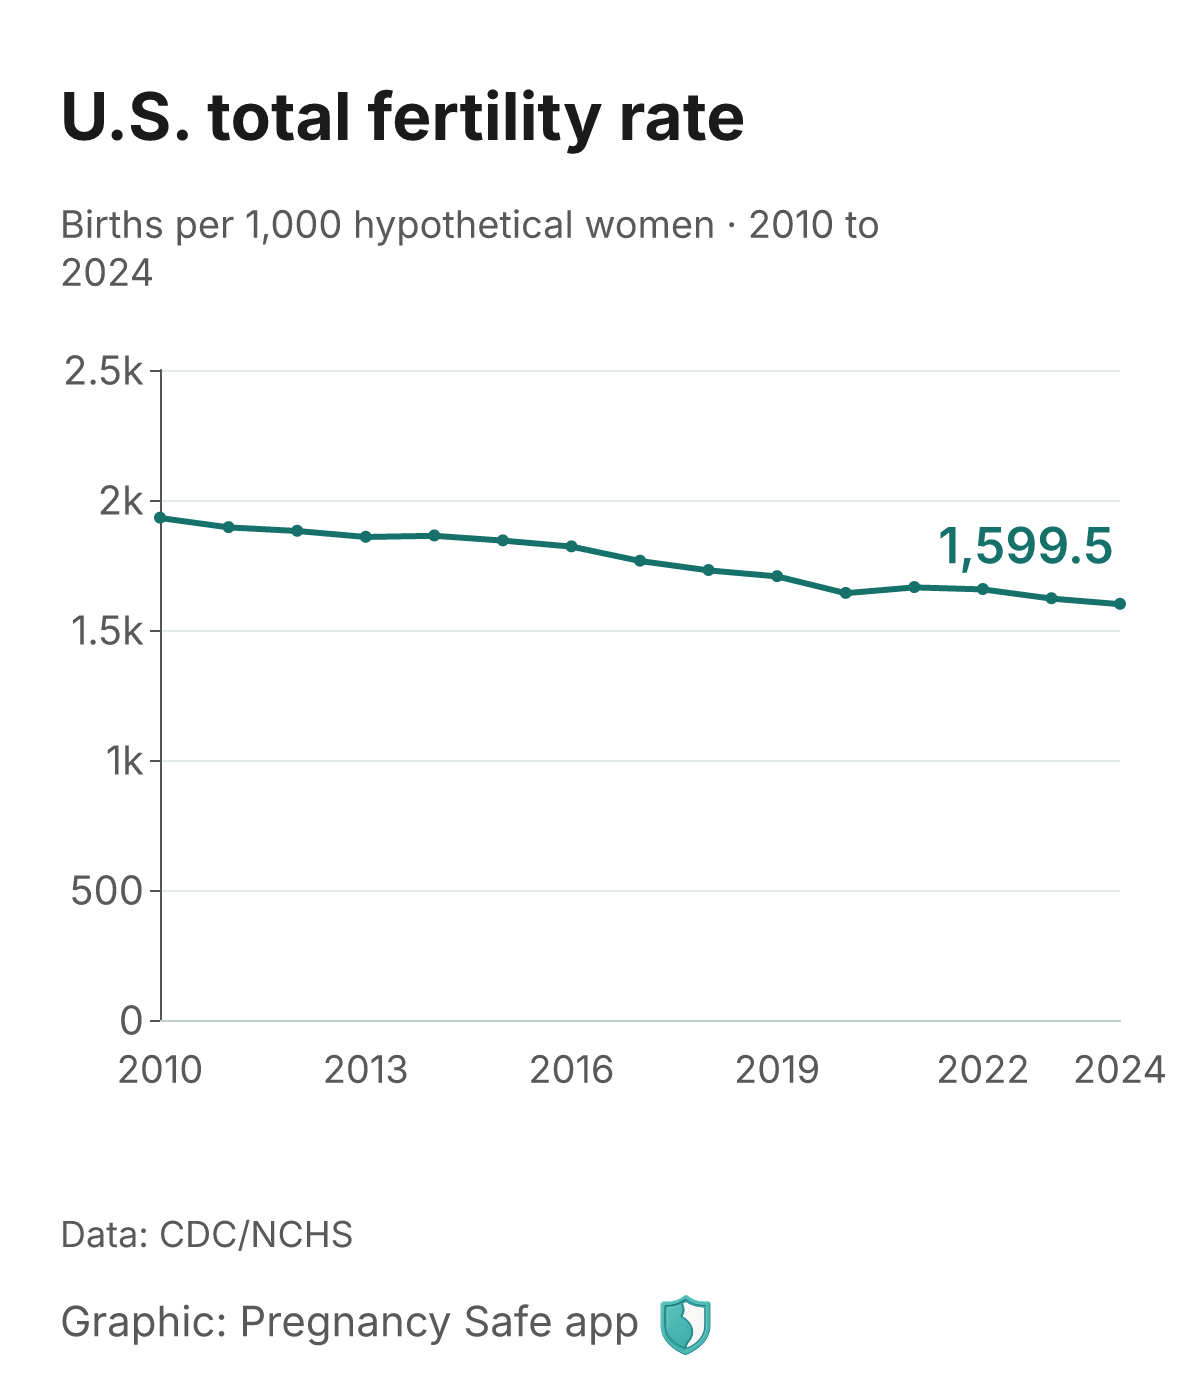
The U.S. total fertility rate was 1,599.5 births per 1,000 hypothetical women in 2024.
Source: CDC, National Center for Health Statistics (NCHS)
Download imageEstimated pregnancy outcomes in the U.S.
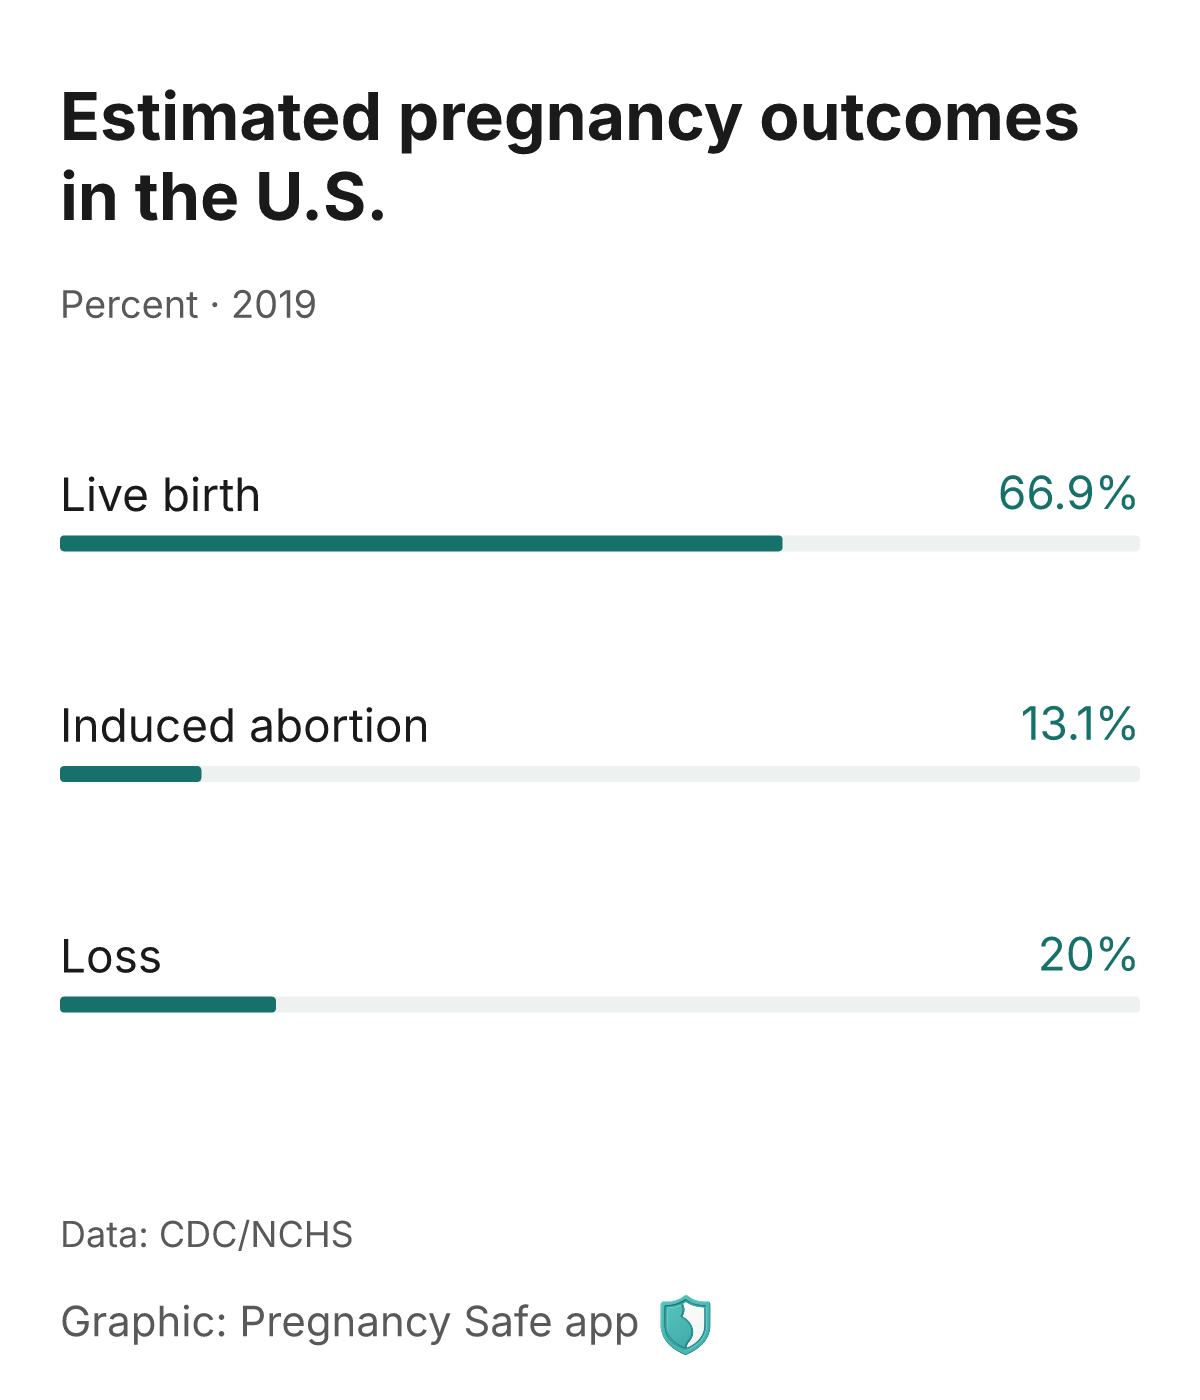
NCHS estimated that 20.0% of U.S. pregnancies ending in 2019 ended in loss, a category including miscarriage, ectopic pregnancy and stillbirth.
Source: CDC/NCHS
Download imagePrenatal care and maternal health
First trimester prenatal care in the U.S.
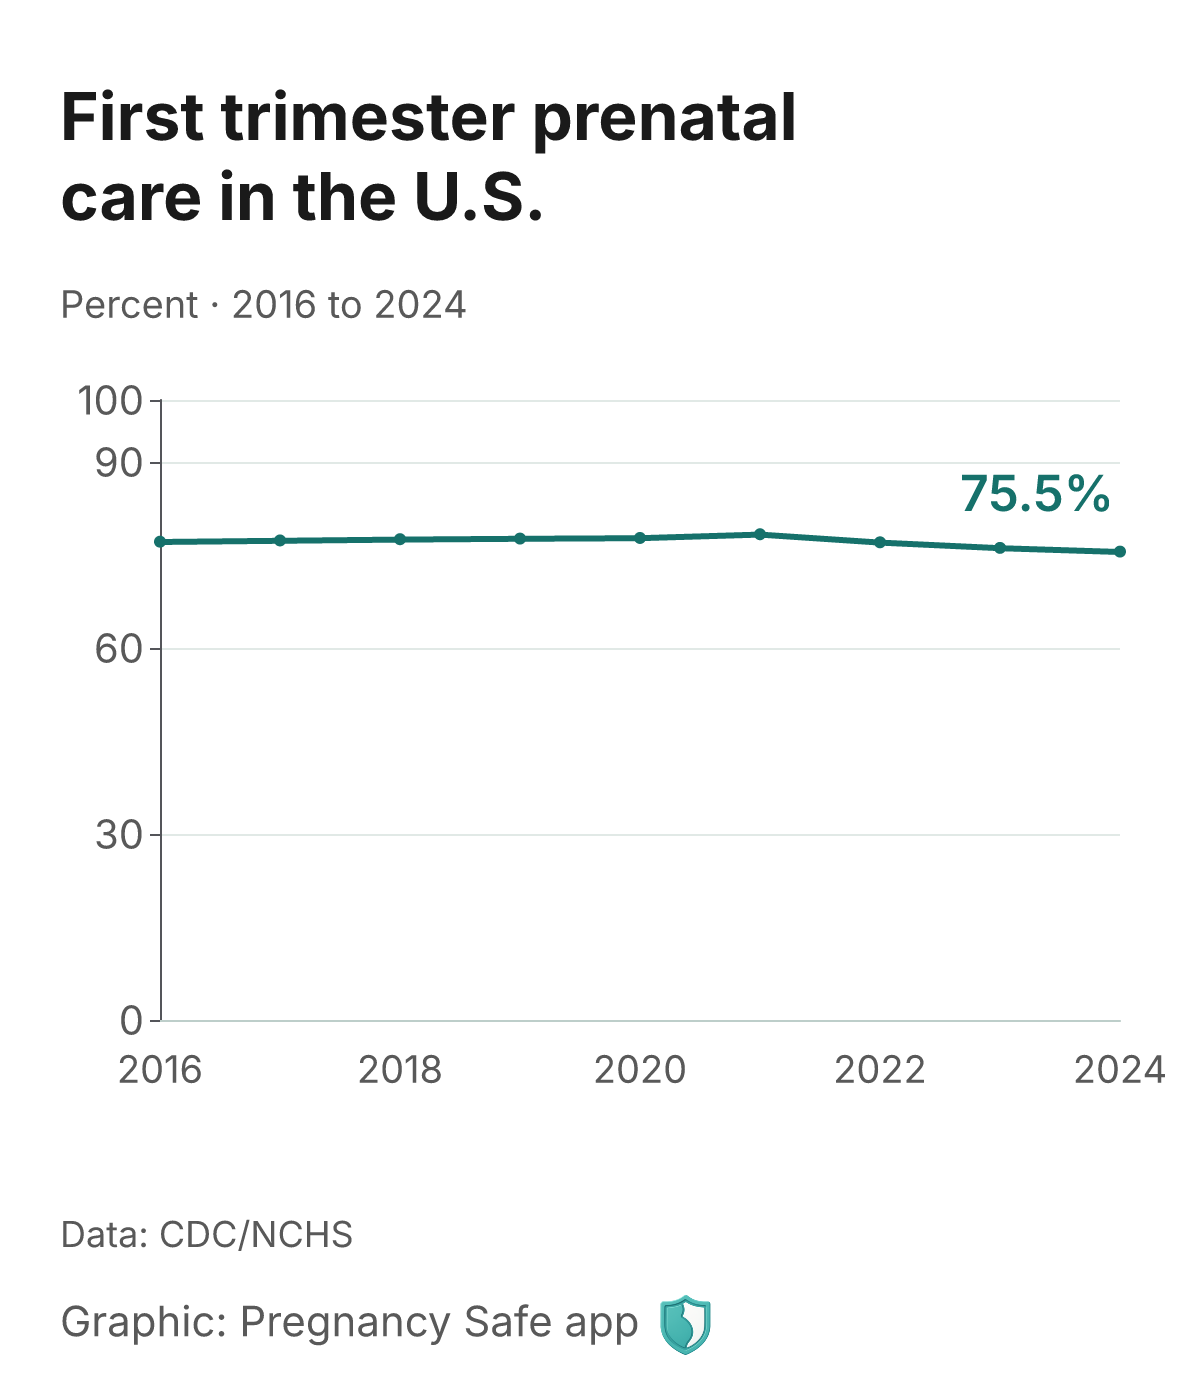
Among 2024 U.S. live births with known prenatal care timing, 75.5% were to mothers who began care in the first trimester.
Source: CDC, National Center for Health Statistics (NCHS)
Download imageGestational diabetes by race and ethnicity
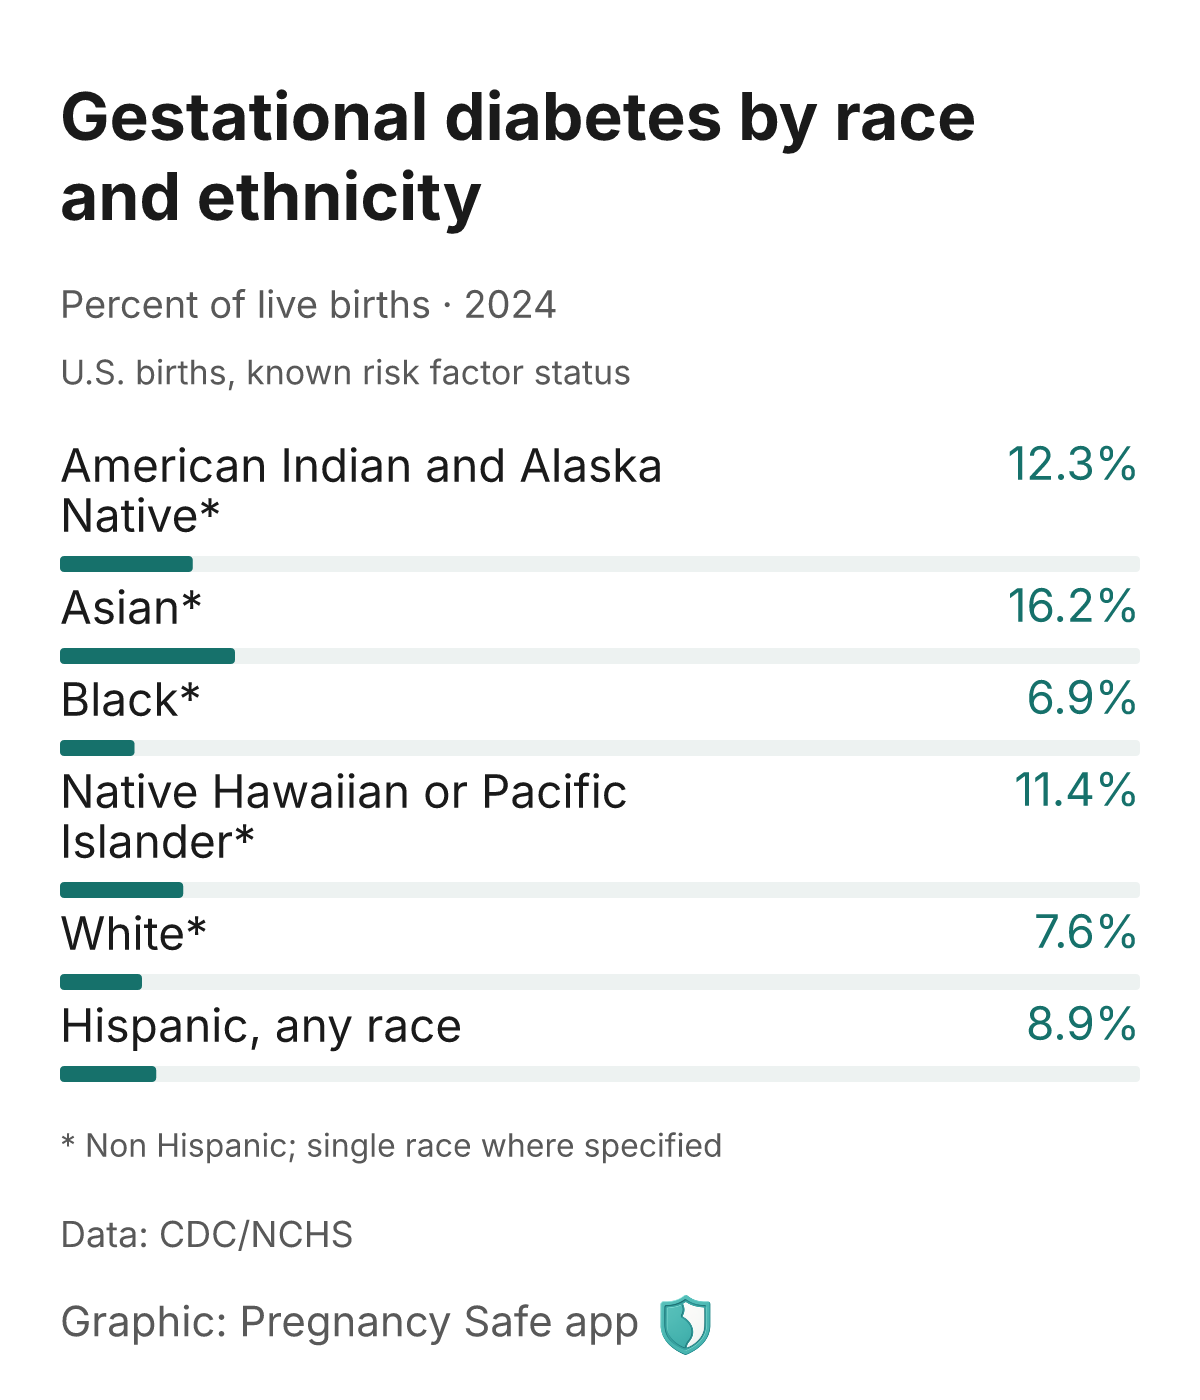
Gestational diabetes was recorded for 8.5% of U.S. live births with known pregnancy risk factor information in 2024.
Source: CDC, National Center for Health Statistics (NCHS)
Download imagePrepregnancy BMI of 25 or higher
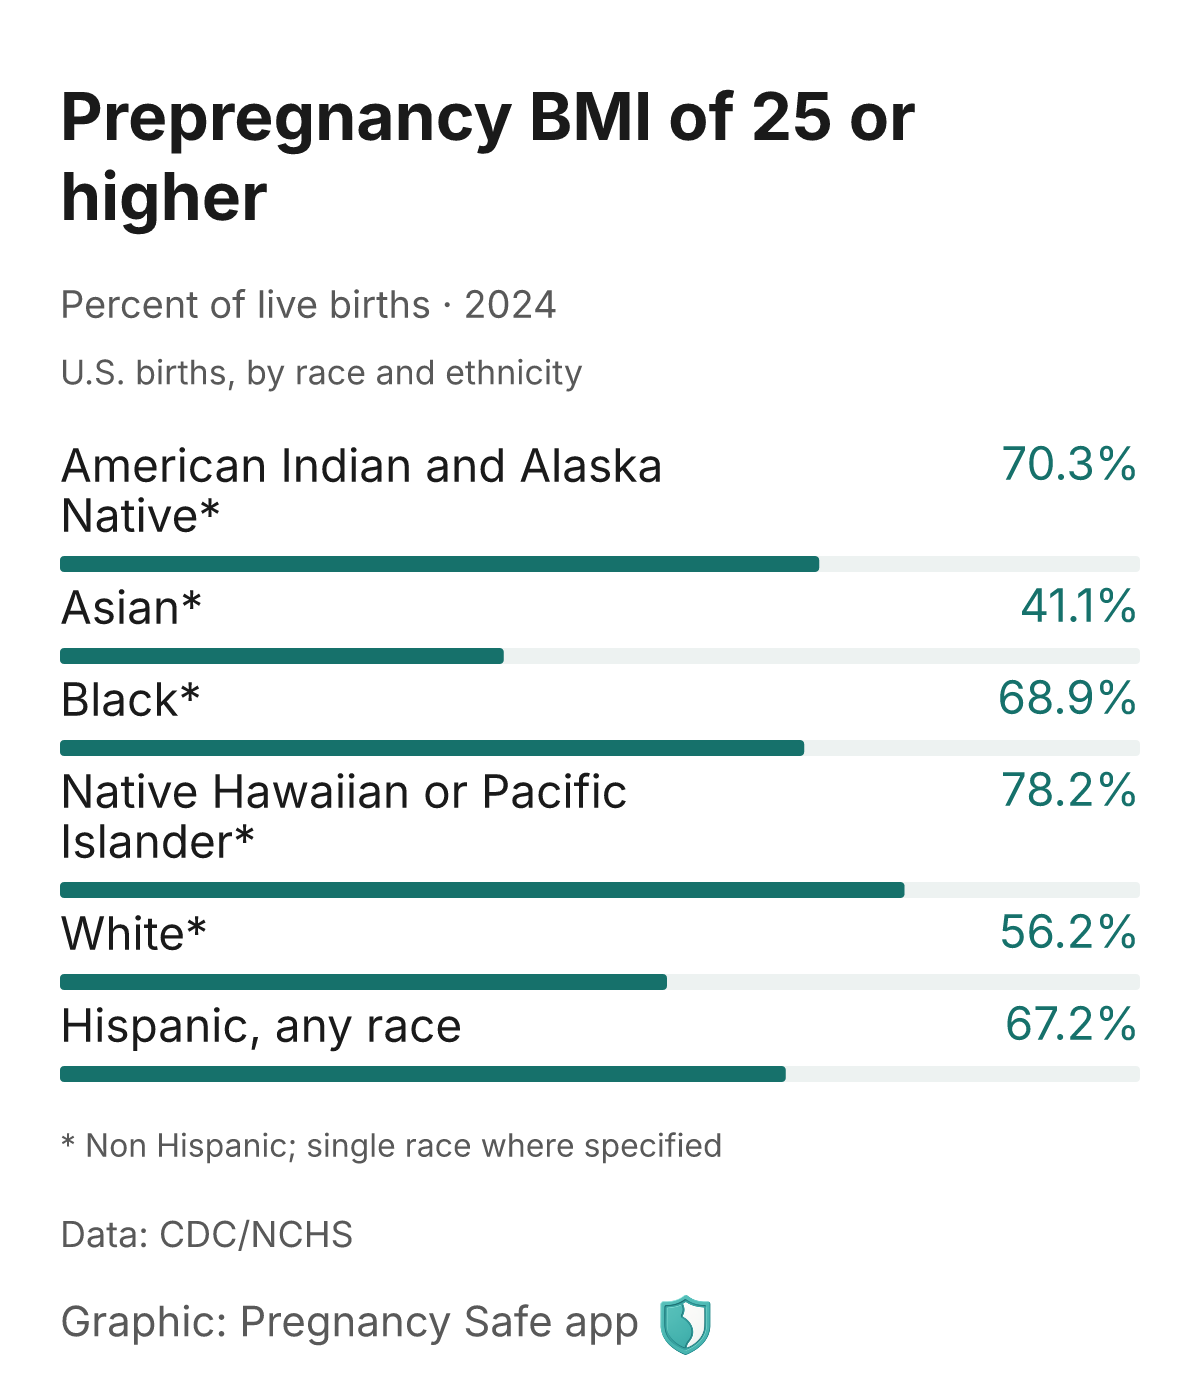
In 2024, 60.1% of U.S. live births with known maternal prepregnancy BMI were to mothers with a BMI of 25.0 or higher.
Source: CDC, National Center for Health Statistics (NCHS)
Download imageGestational hypertension in the U.S.
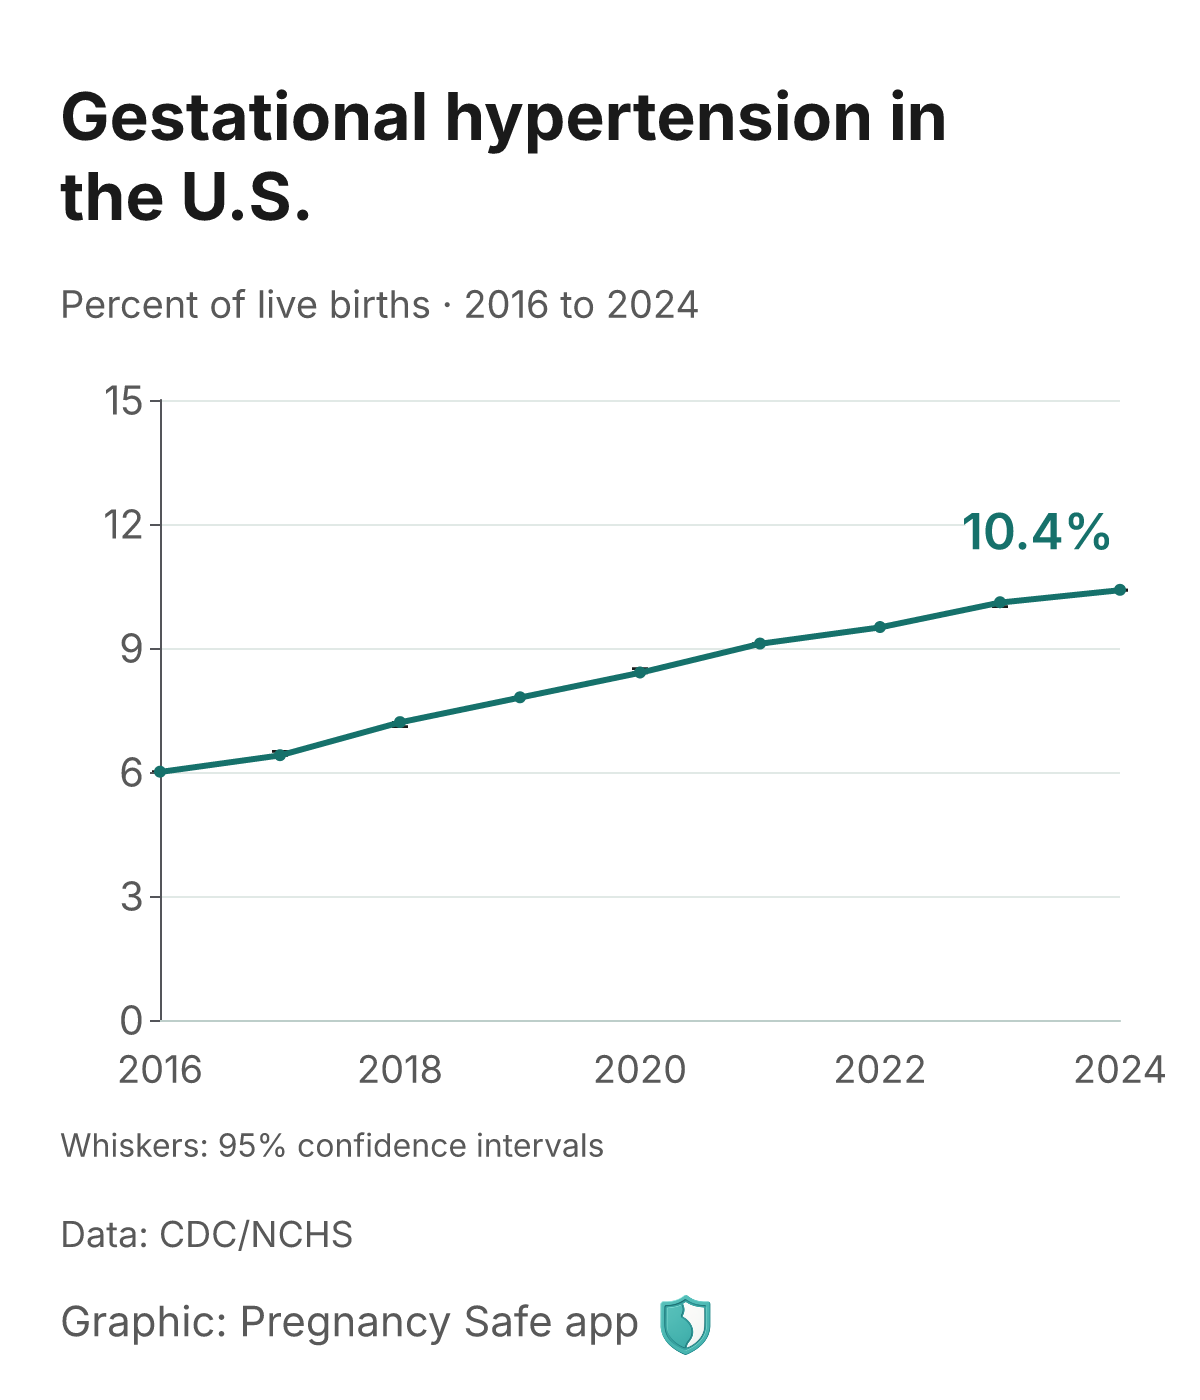
Birth certificate gestational hypertension, including pregnancy induced hypertension and preeclampsia, was recorded for 10.4% of U.S. live births with known risk factor information in 2024.
Source: CDC/NCHS
Download imageMaternal syphilis in the U.S.
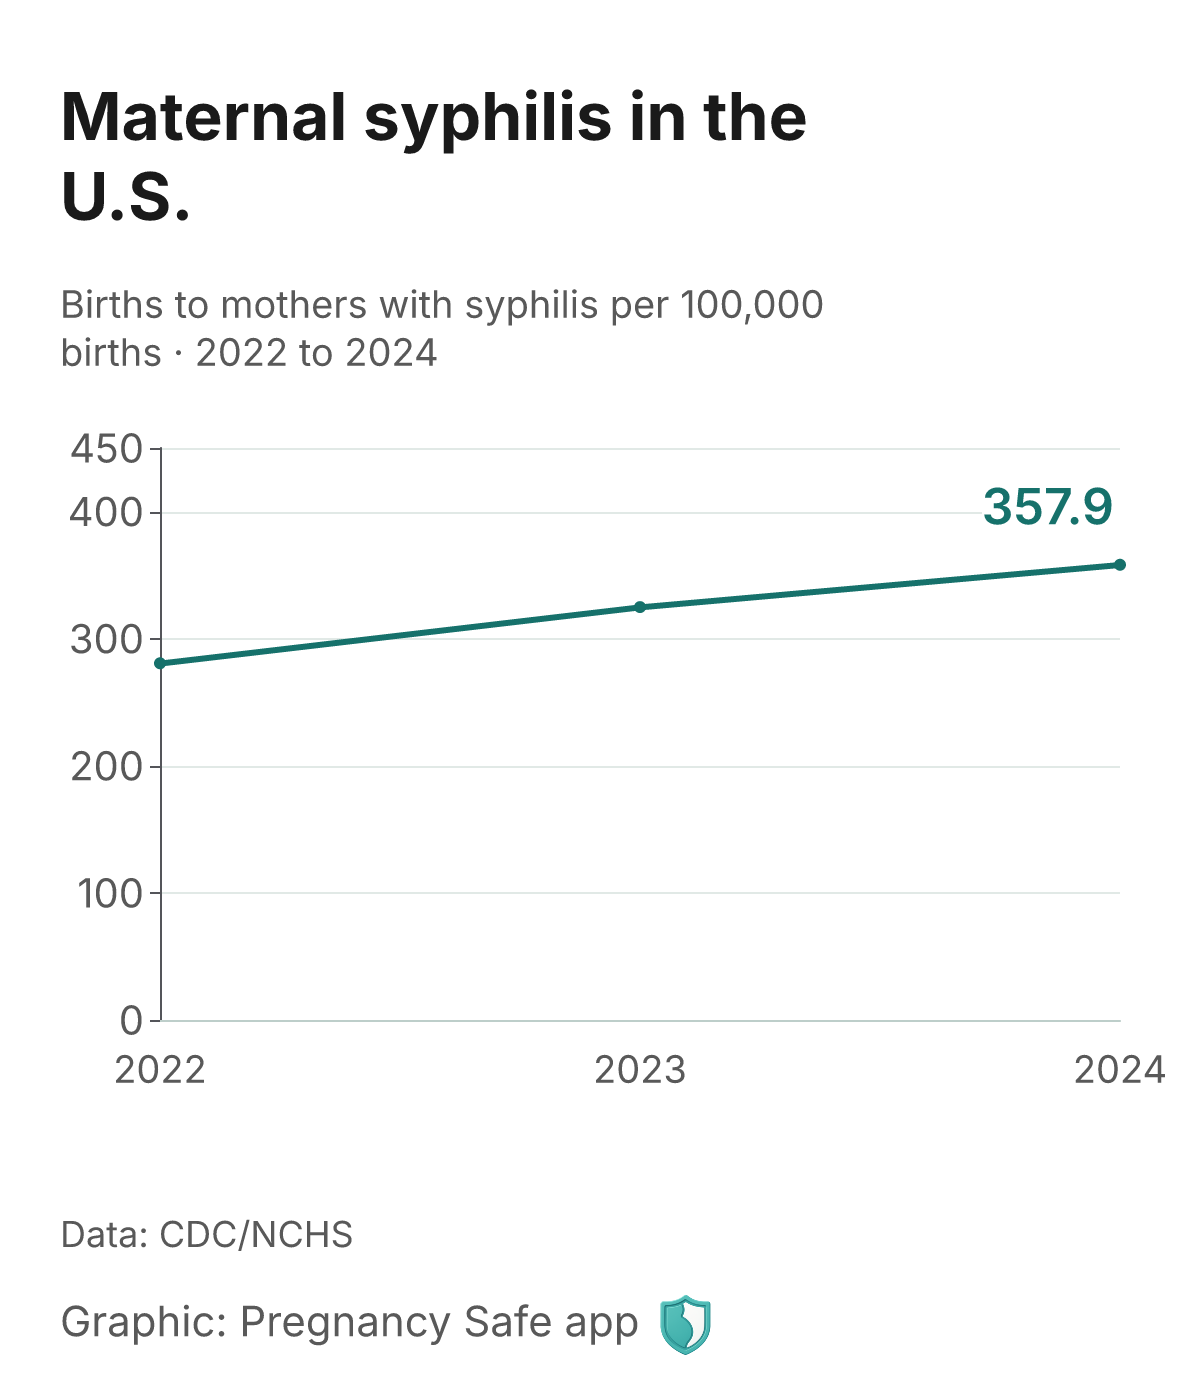
The 2024 U.S. maternal syphilis rate was 357.9 live births to mothers with syphilis per 100,000 births with known infection information.
Source: CDC/NCHS
Download imagePayment sources for U.S. deliveries
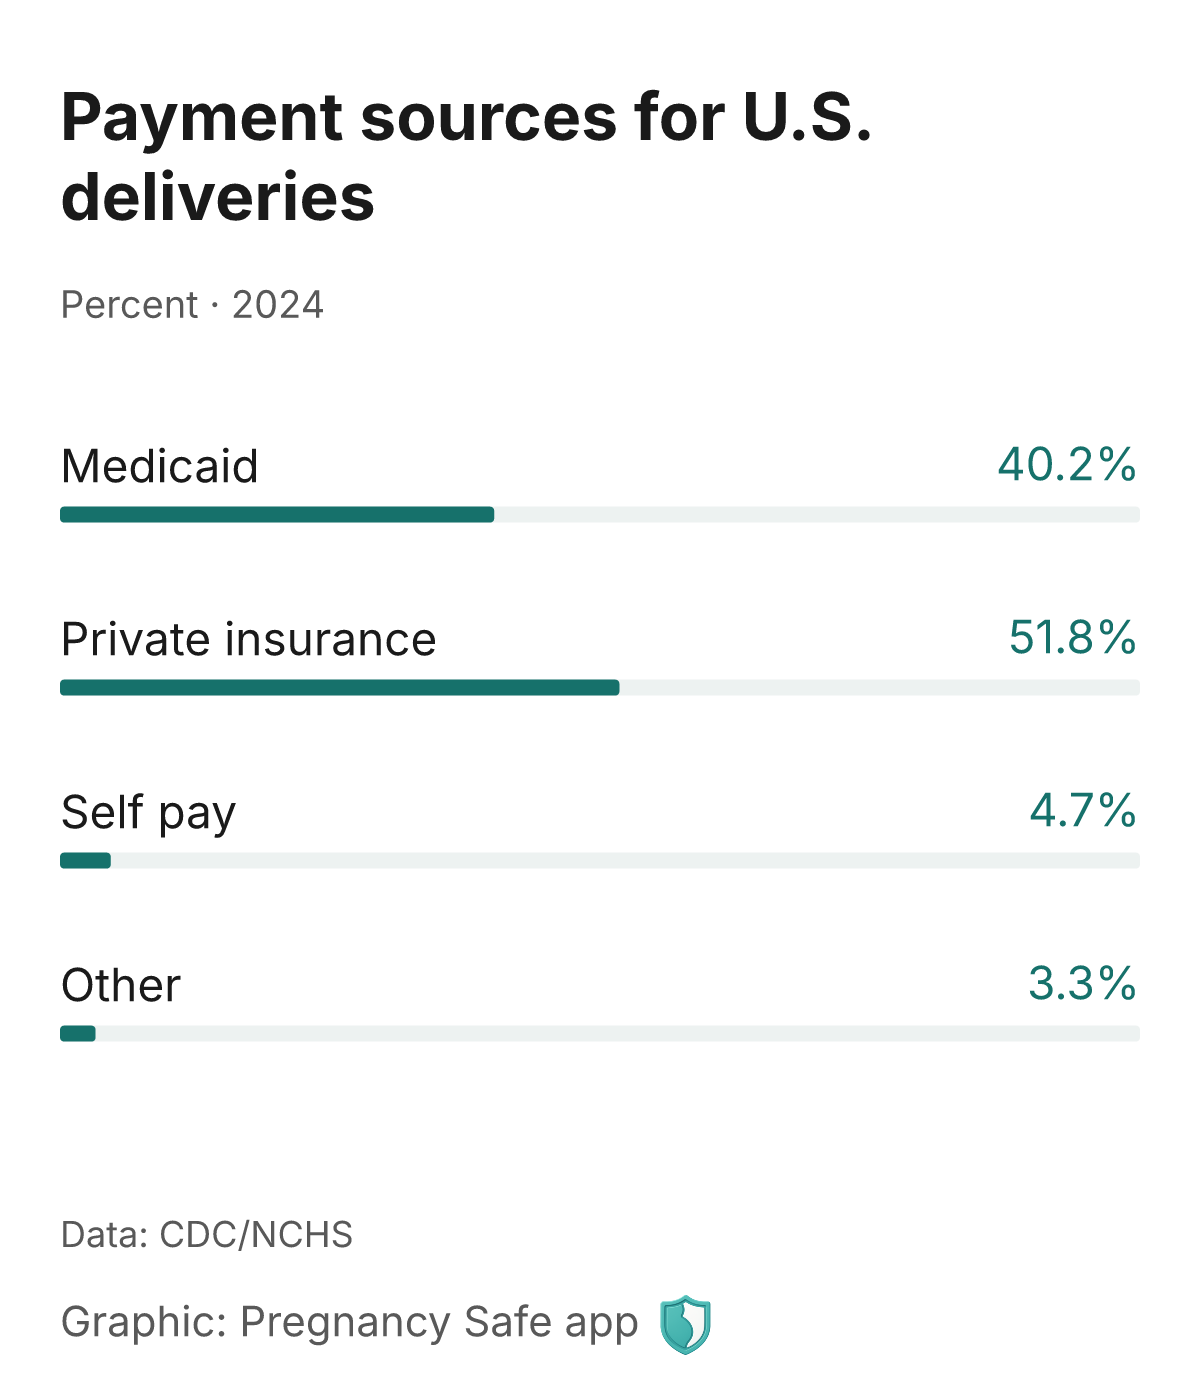
Among U.S. live birth records with known principal payment source in 2024, 40.2% identified Medicaid as the principal payer for delivery.
Source: CDC, National Center for Health Statistics (NCHS)
Download imageWIC during pregnancy by maternal age
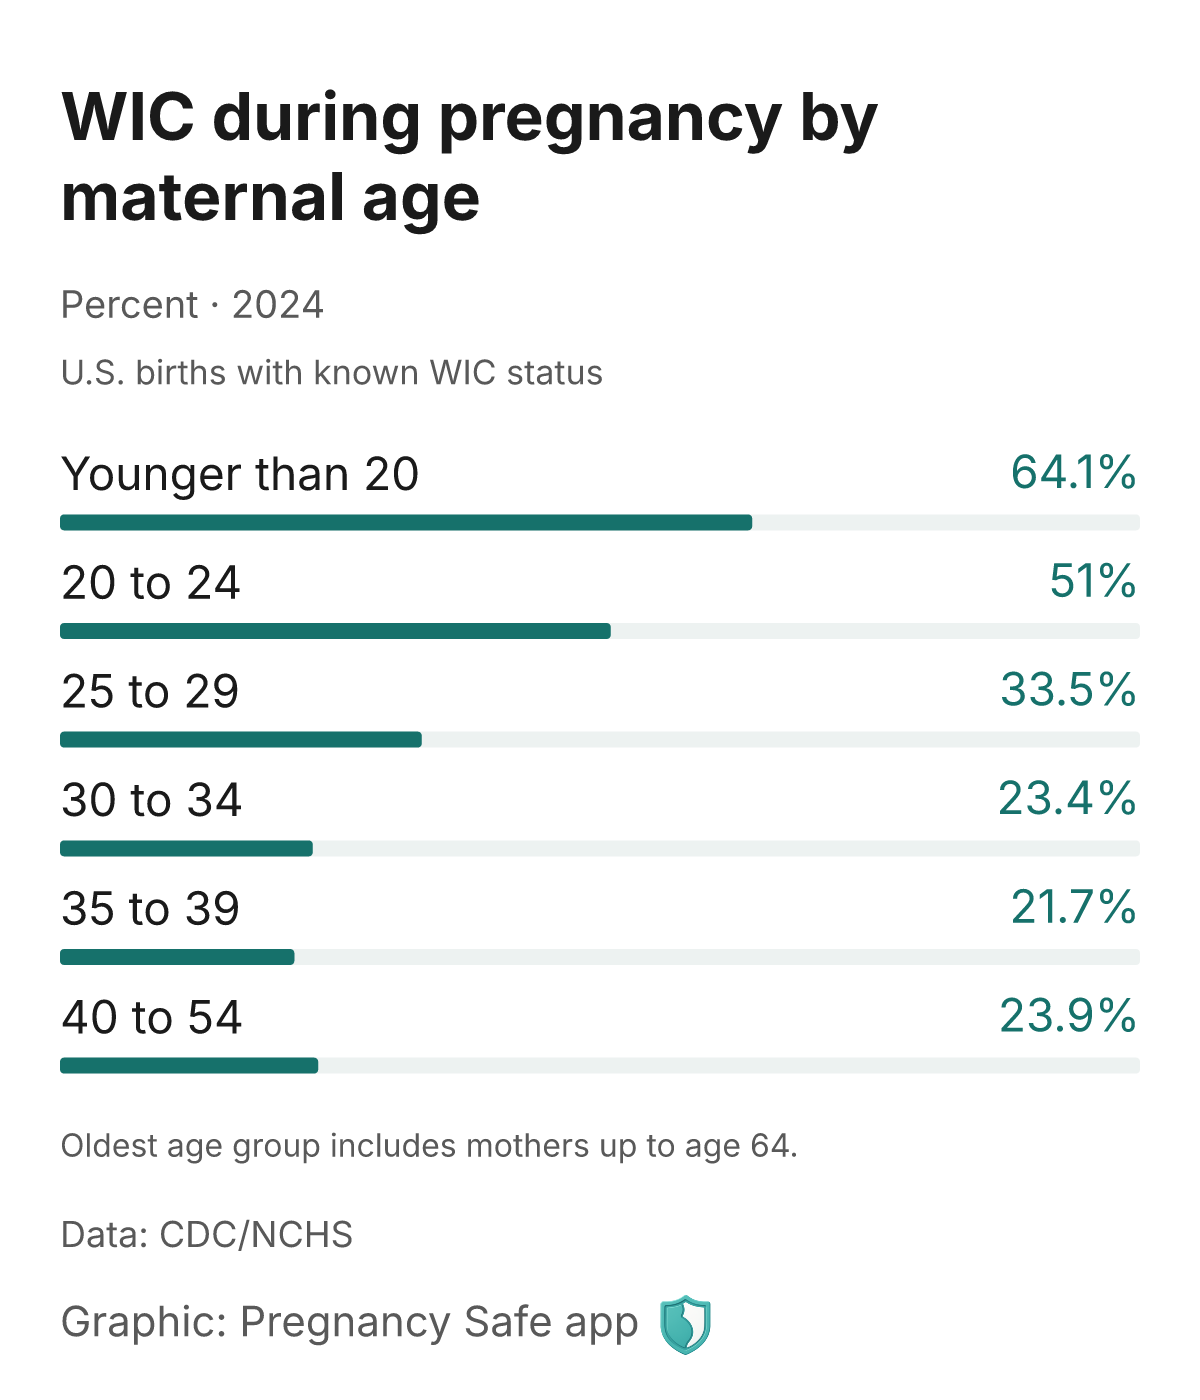
Among 2024 U.S. live births with known WIC status, 32.1% were to mothers who received WIC food for themselves during pregnancy.
Source: CDC, National Center for Health Statistics (NCHS)
Download imageLabor, delivery and newborns
Cesarean births in the U.S.
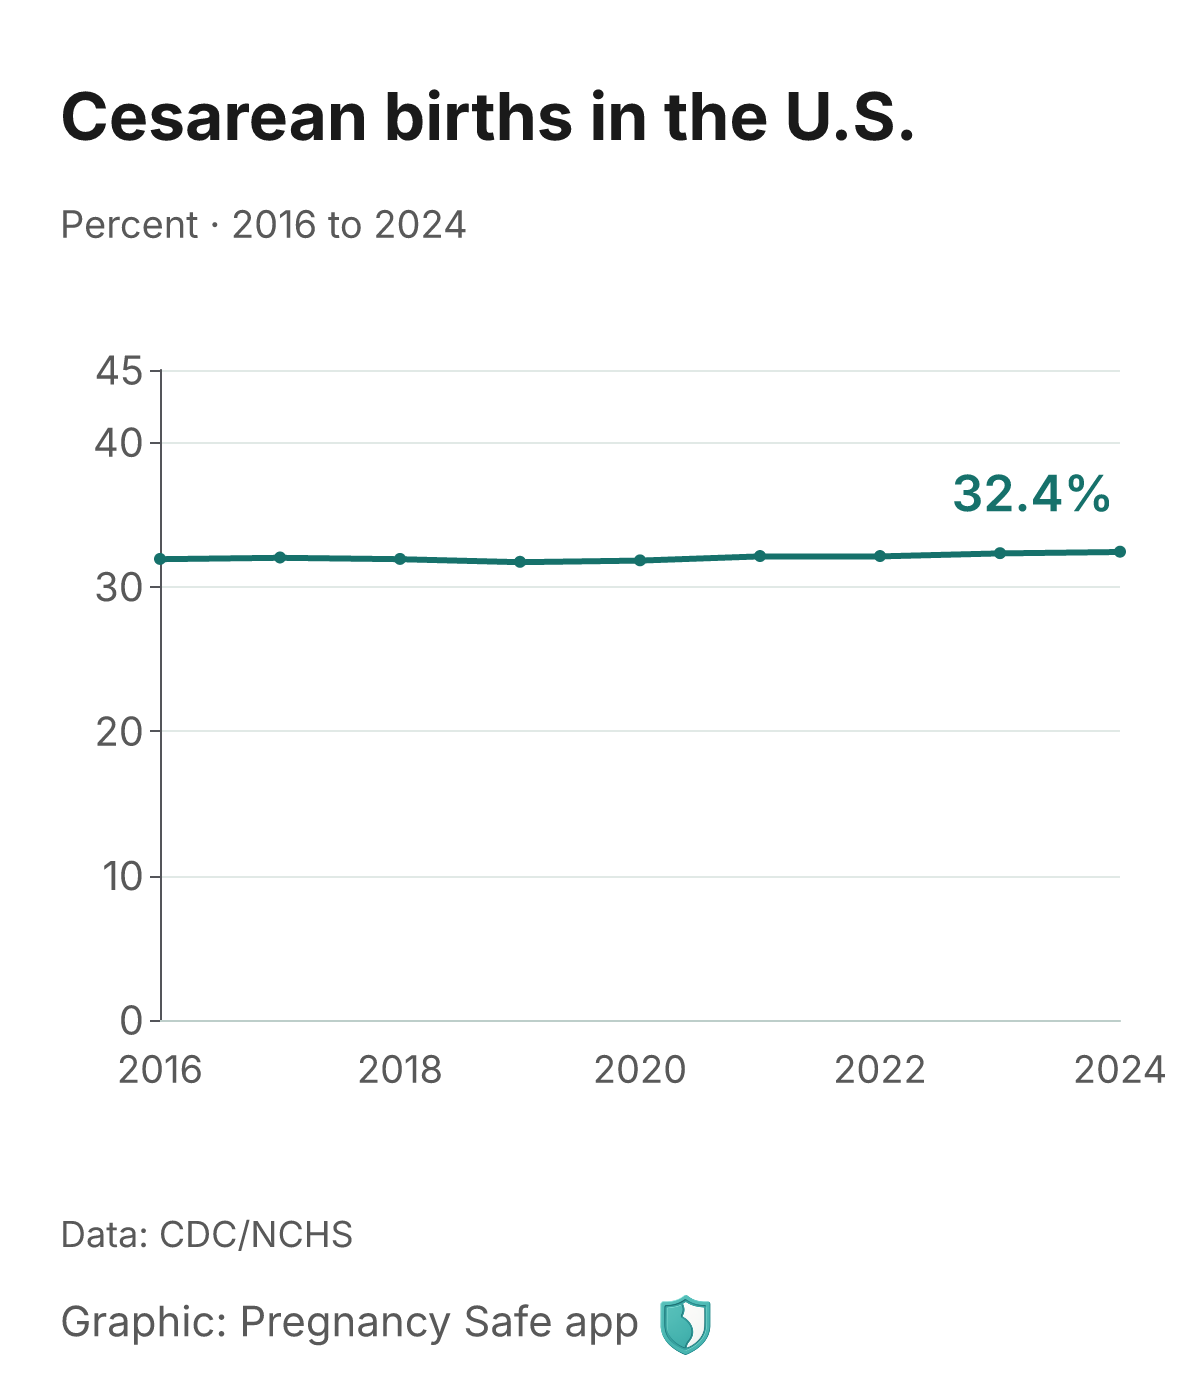
In 2024, 32.4% of U.S. live births with a stated delivery method were delivered by cesarean.
Source: CDC, National Center for Health Statistics (NCHS)
Download imagePreterm births in the U.S.
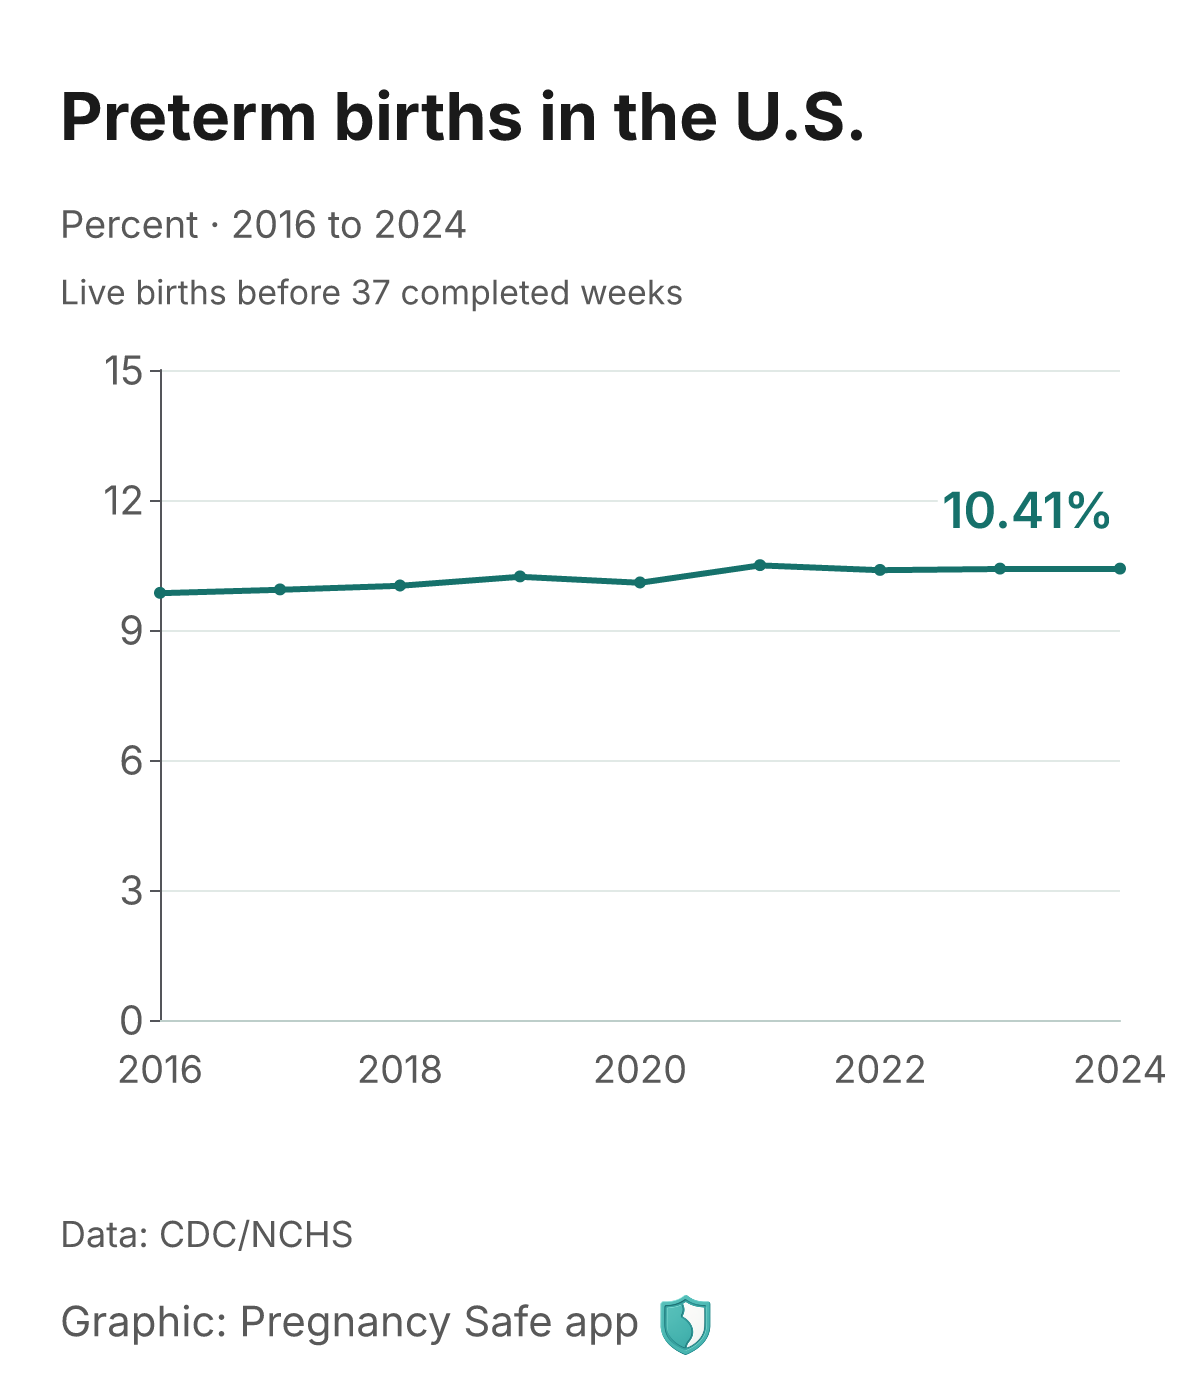
In 2024, 10.41% of U.S. live births with a stated obstetric estimate of gestational age occurred before 37 completed weeks.
Source: CDC, National Center for Health Statistics (NCHS)
Download imageLabor induction by race and ethnicity
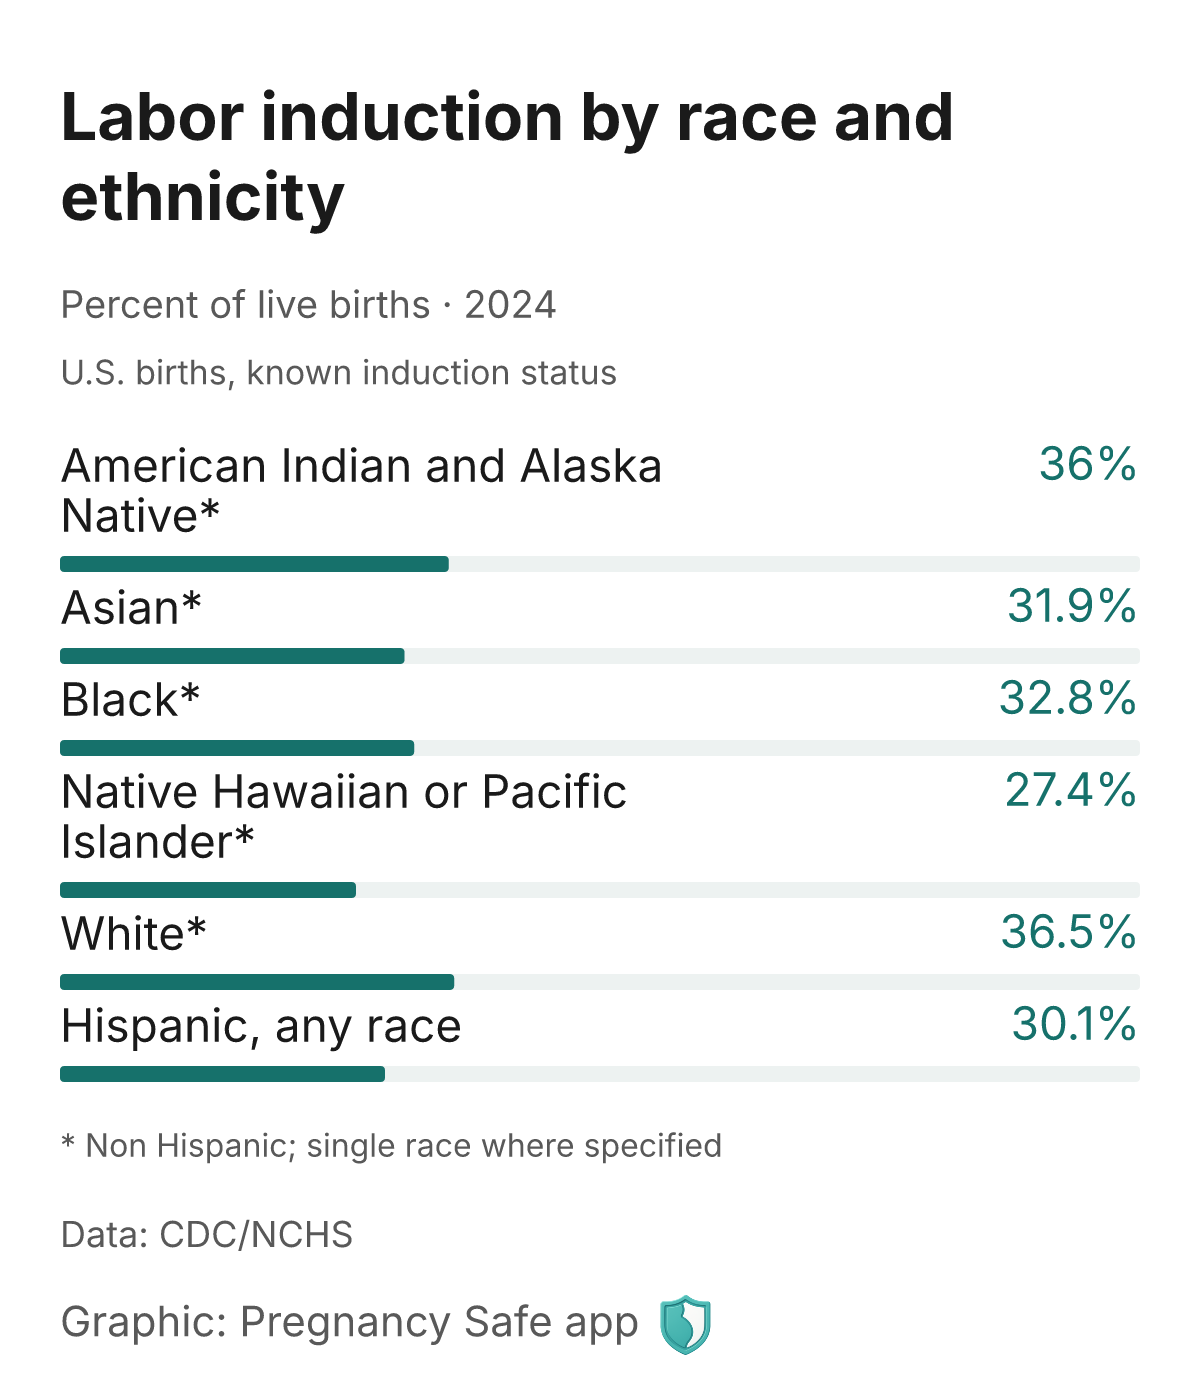
Induction of labor was recorded for 33.9% of U.S. live births with known induction information in 2024.
Source: CDC, National Center for Health Statistics (NCHS)
Download imageLow birthweight in the U.S.
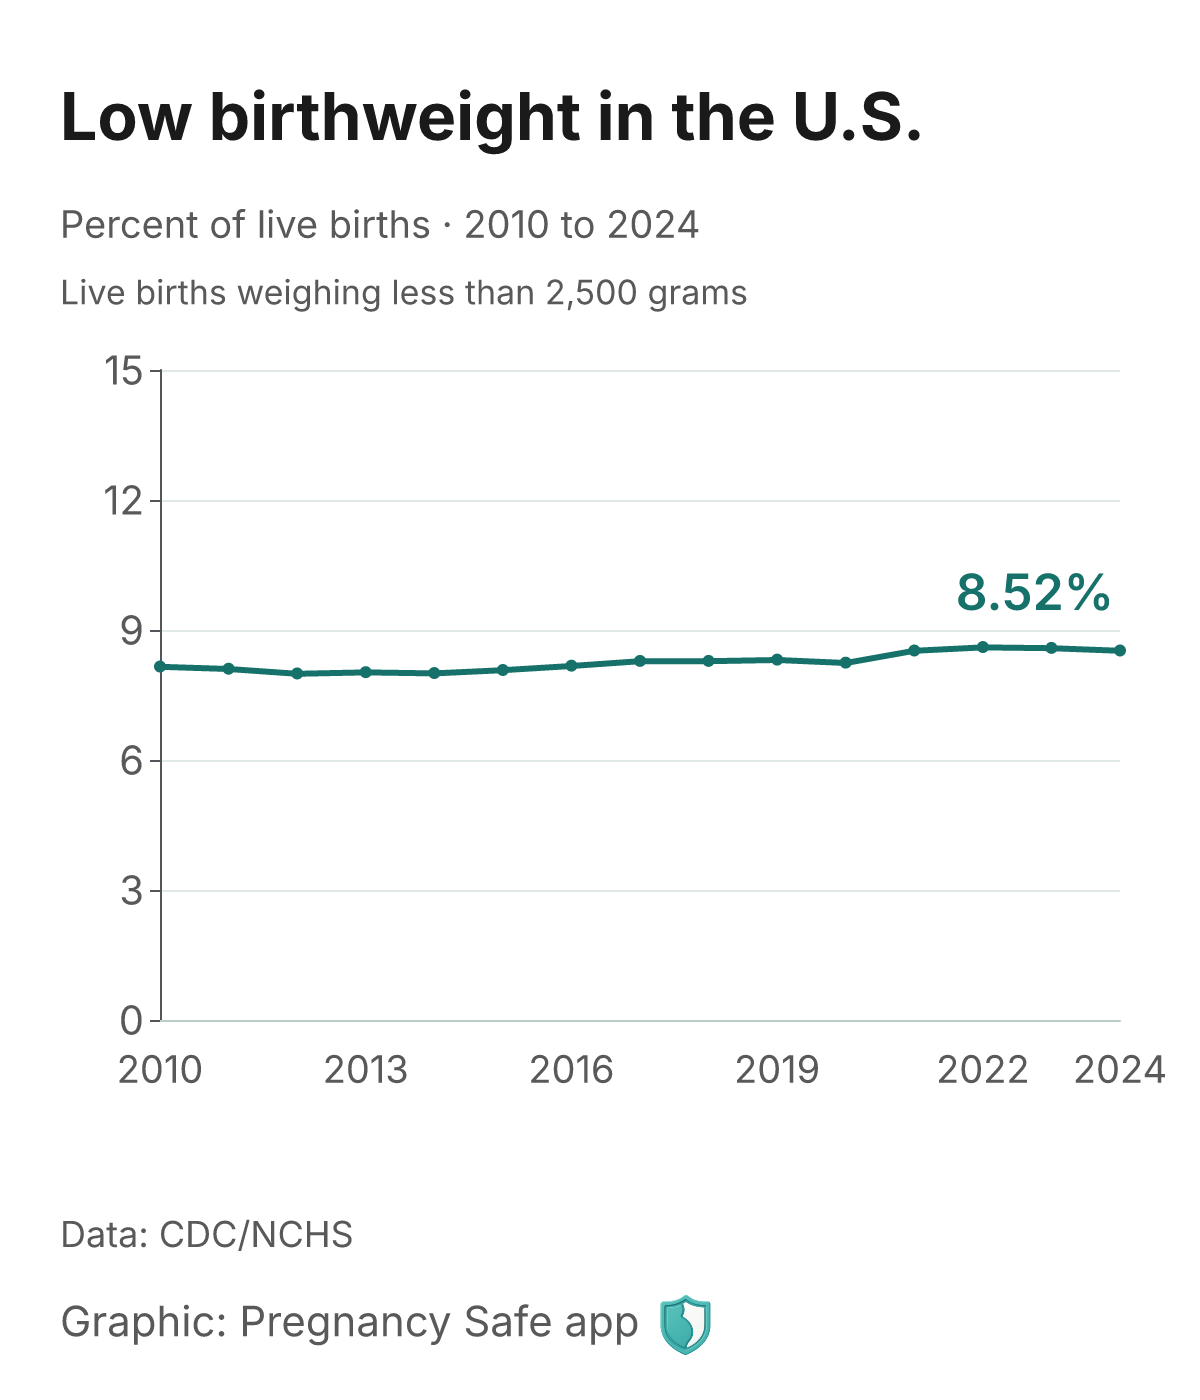
In 2024, 8.52% of U.S. live births with known birthweight weighed less than 2,500 grams.
Source: CDC, National Center for Health Statistics (NCHS)
Download imageU.S. twin birth rate
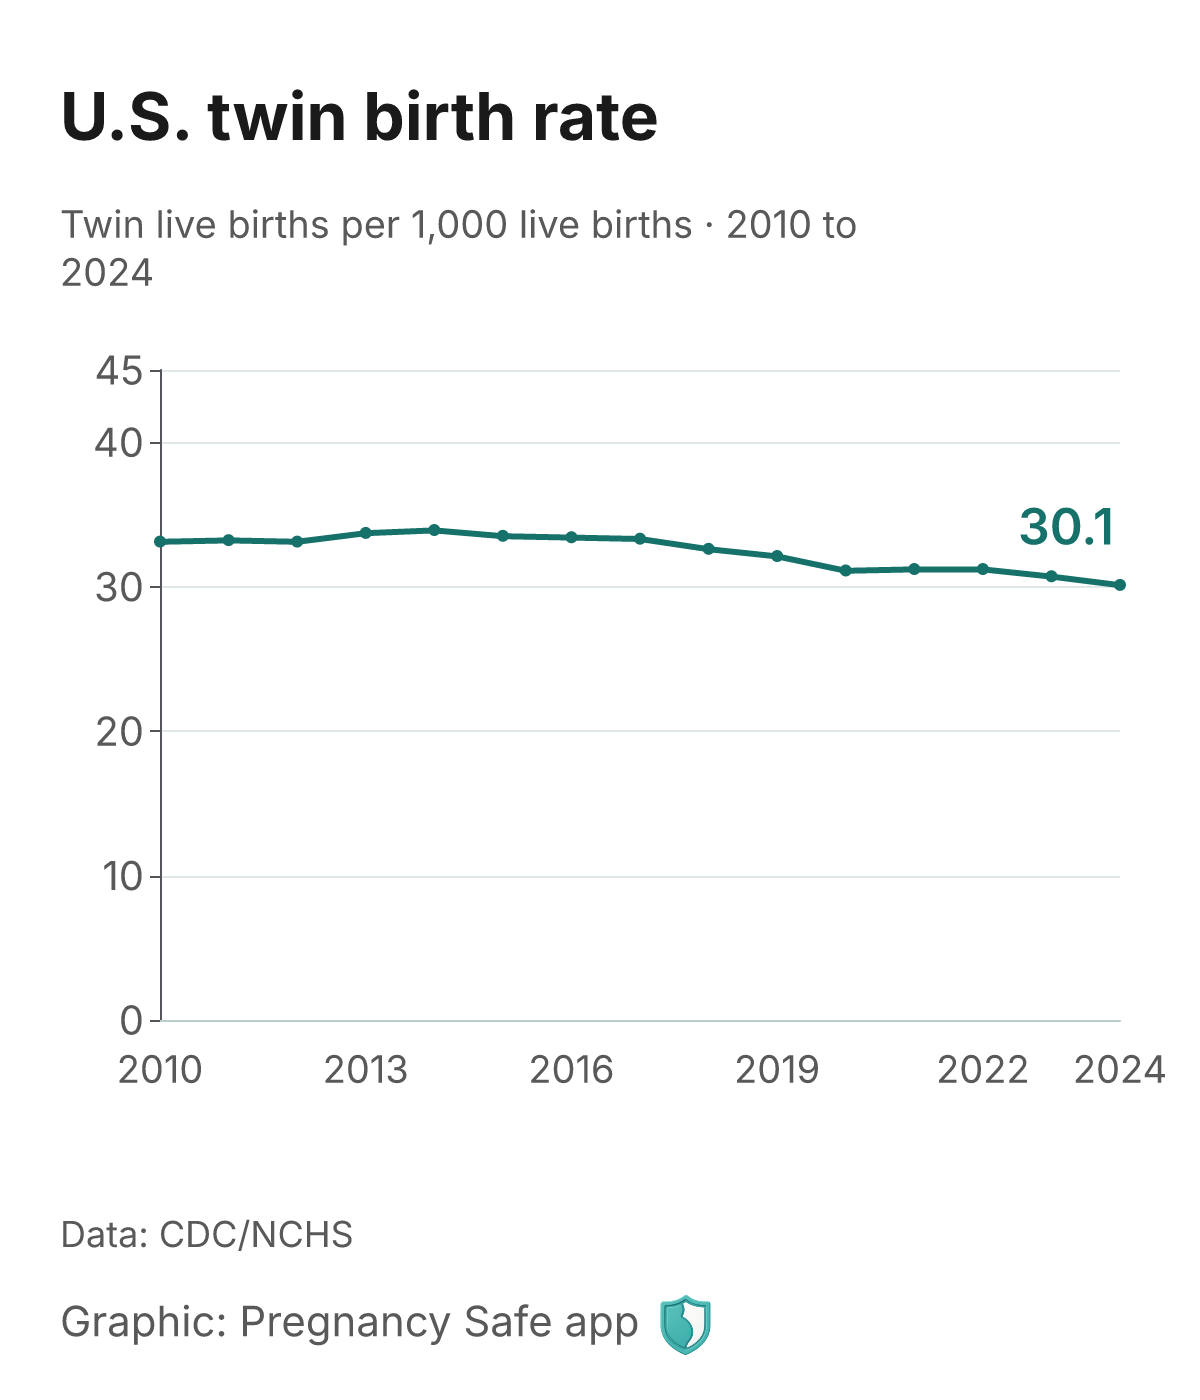
The U.S. twin birth rate was 30.1 live born infants in twin deliveries per 1,000 live births in 2024.
Source: CDC, National Center for Health Statistics (NCHS)
Download imageU.S. fetal mortality rate
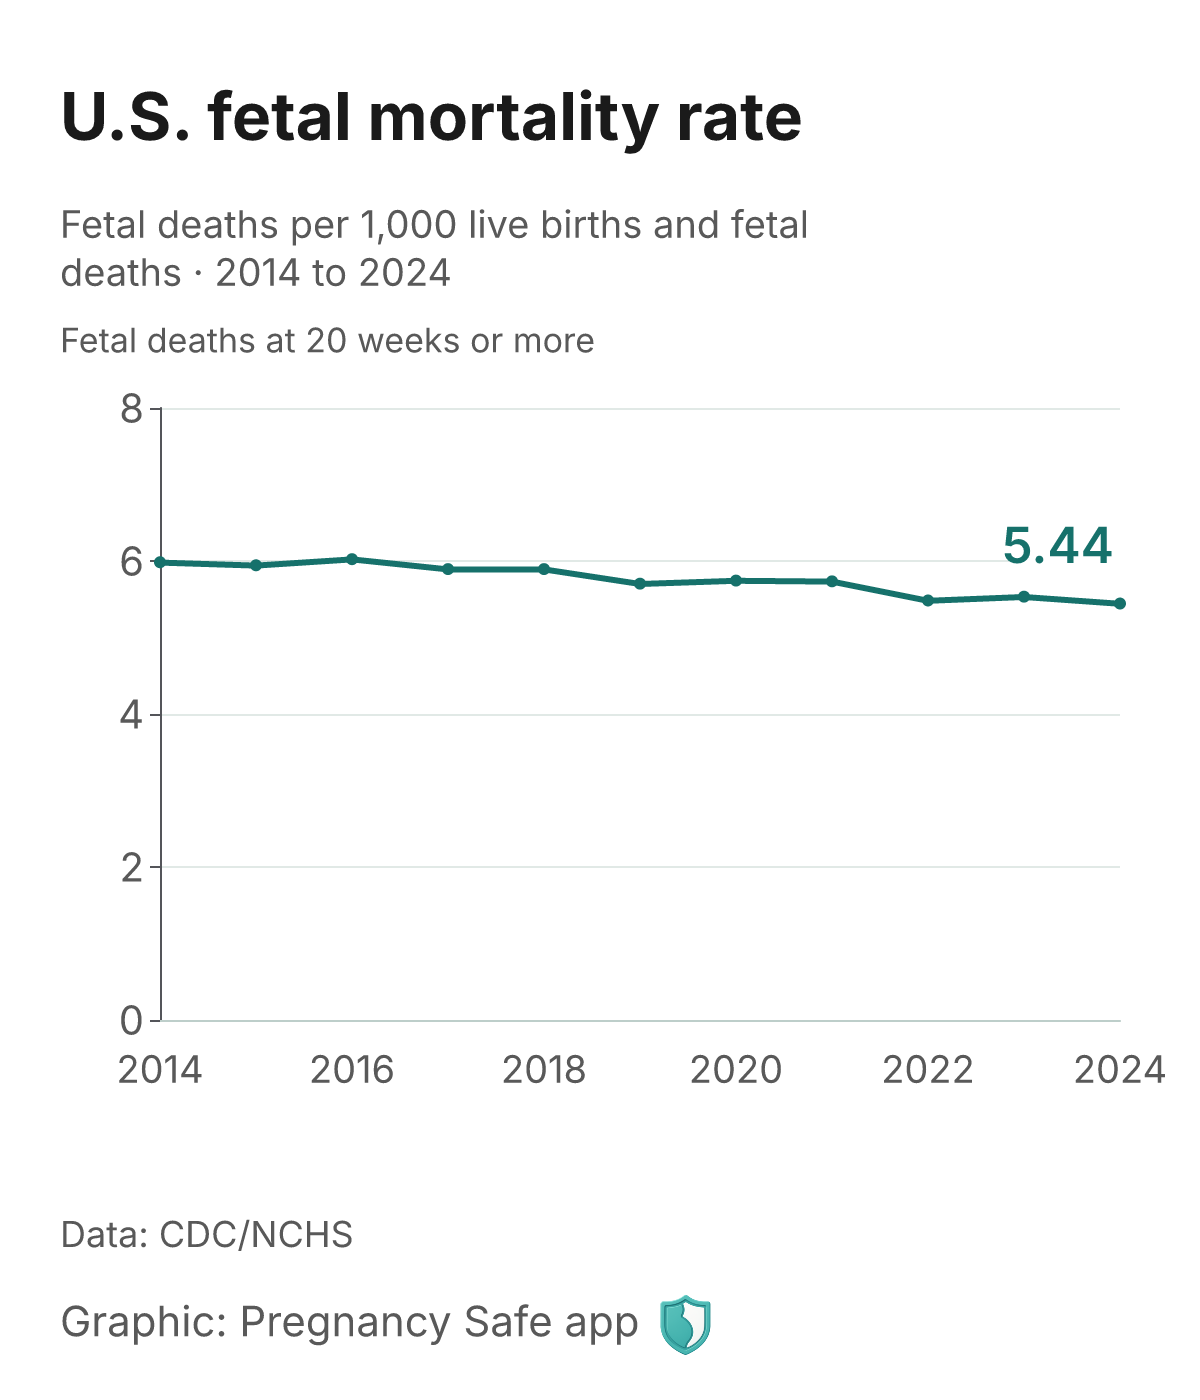
The final 2024 U.S. fetal mortality rate was 5.44 deaths at 20 weeks or more per 1,000 live births and fetal deaths.
Source: CDC/NCHS
Download imageFetal mortality by race and ethnicity
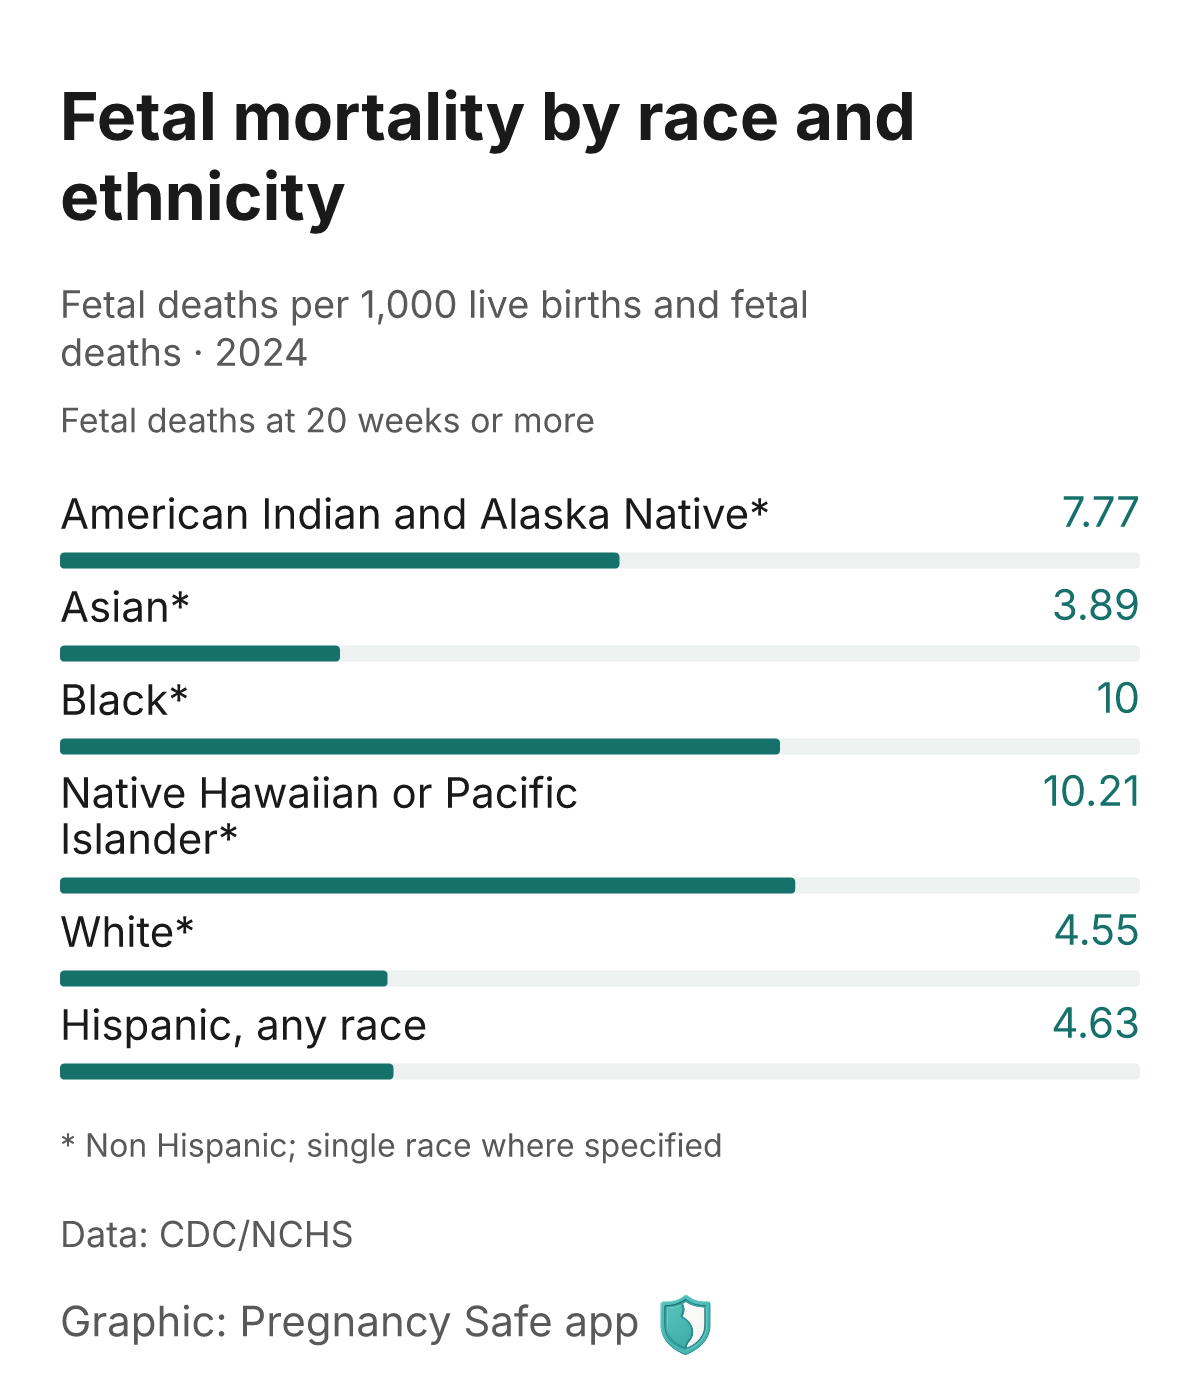
In 2024, the U.S. fetal mortality rate was 10.00 per 1,000 for non Hispanic single race Black mothers and 4.55 for non Hispanic single race White mothers.
Source: CDC/NCHS
Download imagePrimary cesarean births in the U.S.
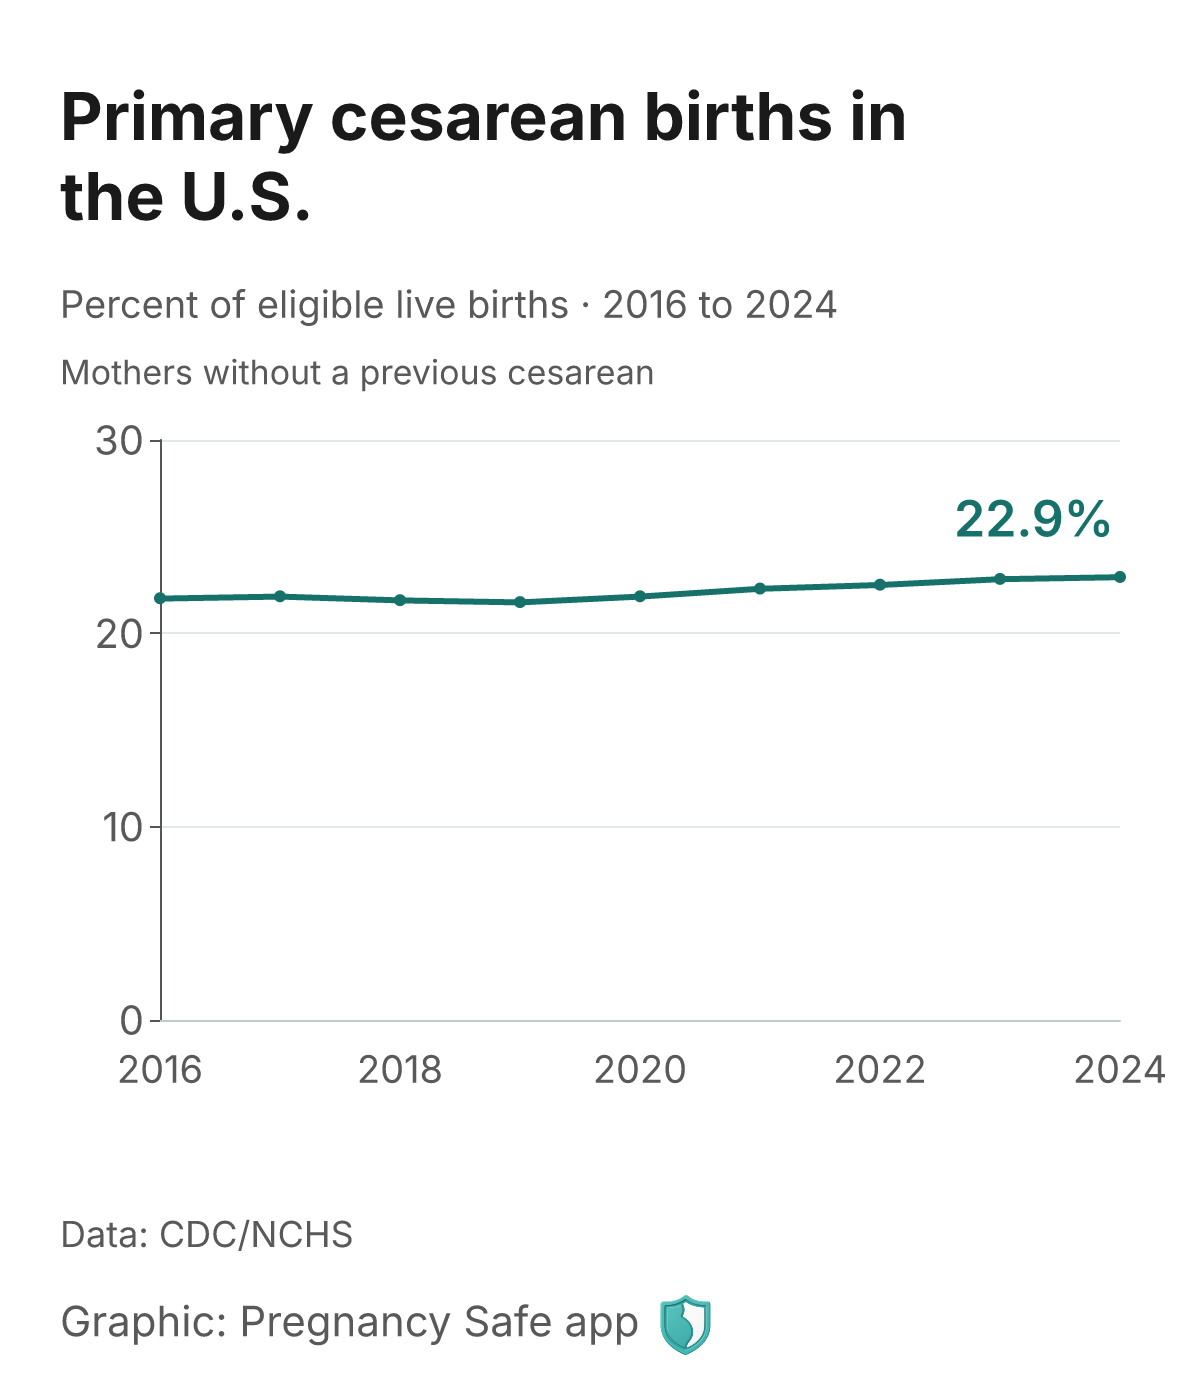
In 2024, 22.9% of U.S. live births to women without a previous cesarean delivery were delivered by cesarean.
Source: CDC, National Center for Health Statistics (NCHS)
Download imageWhere U.S. births take place
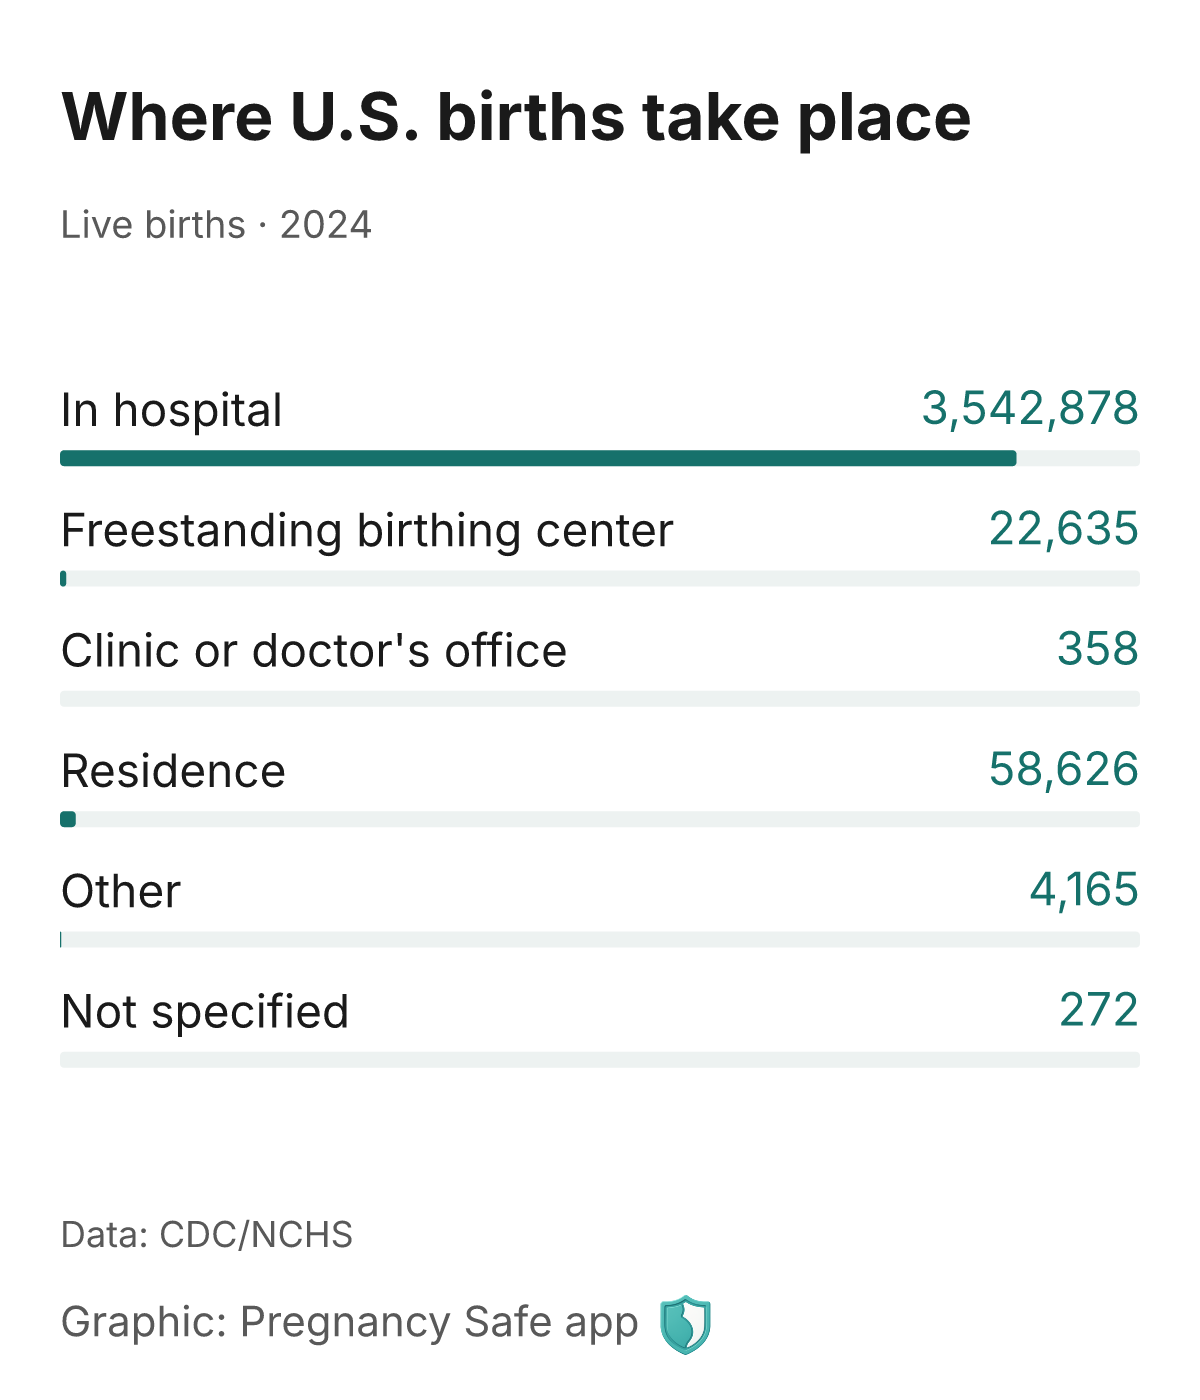
CDC/NCHS recorded 58,626 U.S. live births at a residence in 2024.
Source: CDC, National Center for Health Statistics (NCHS)
Download imageEpidural or spinal anesthesia during labor
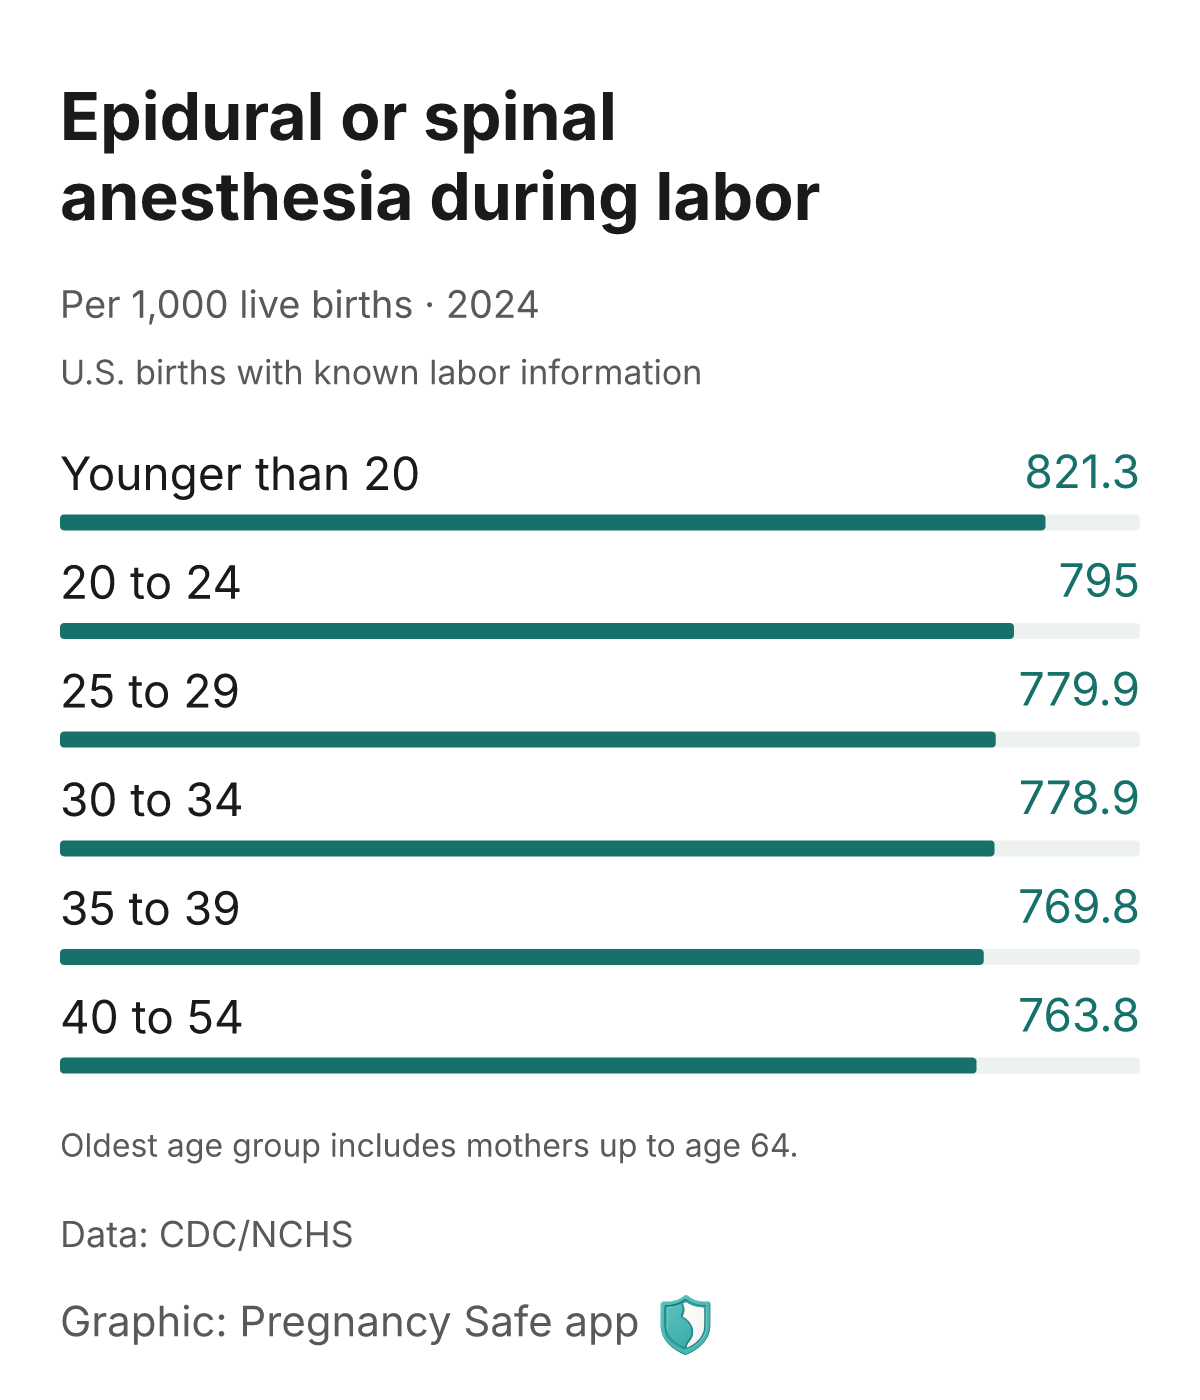
In 2024 U.S. birth records, epidural or spinal anesthesia during labor was recorded for 781.3 per 1,000 live births with known labor characteristic information.
Source: CDC, National Center for Health Statistics (NCHS)
Download imageLabor antibiotics by maternal age
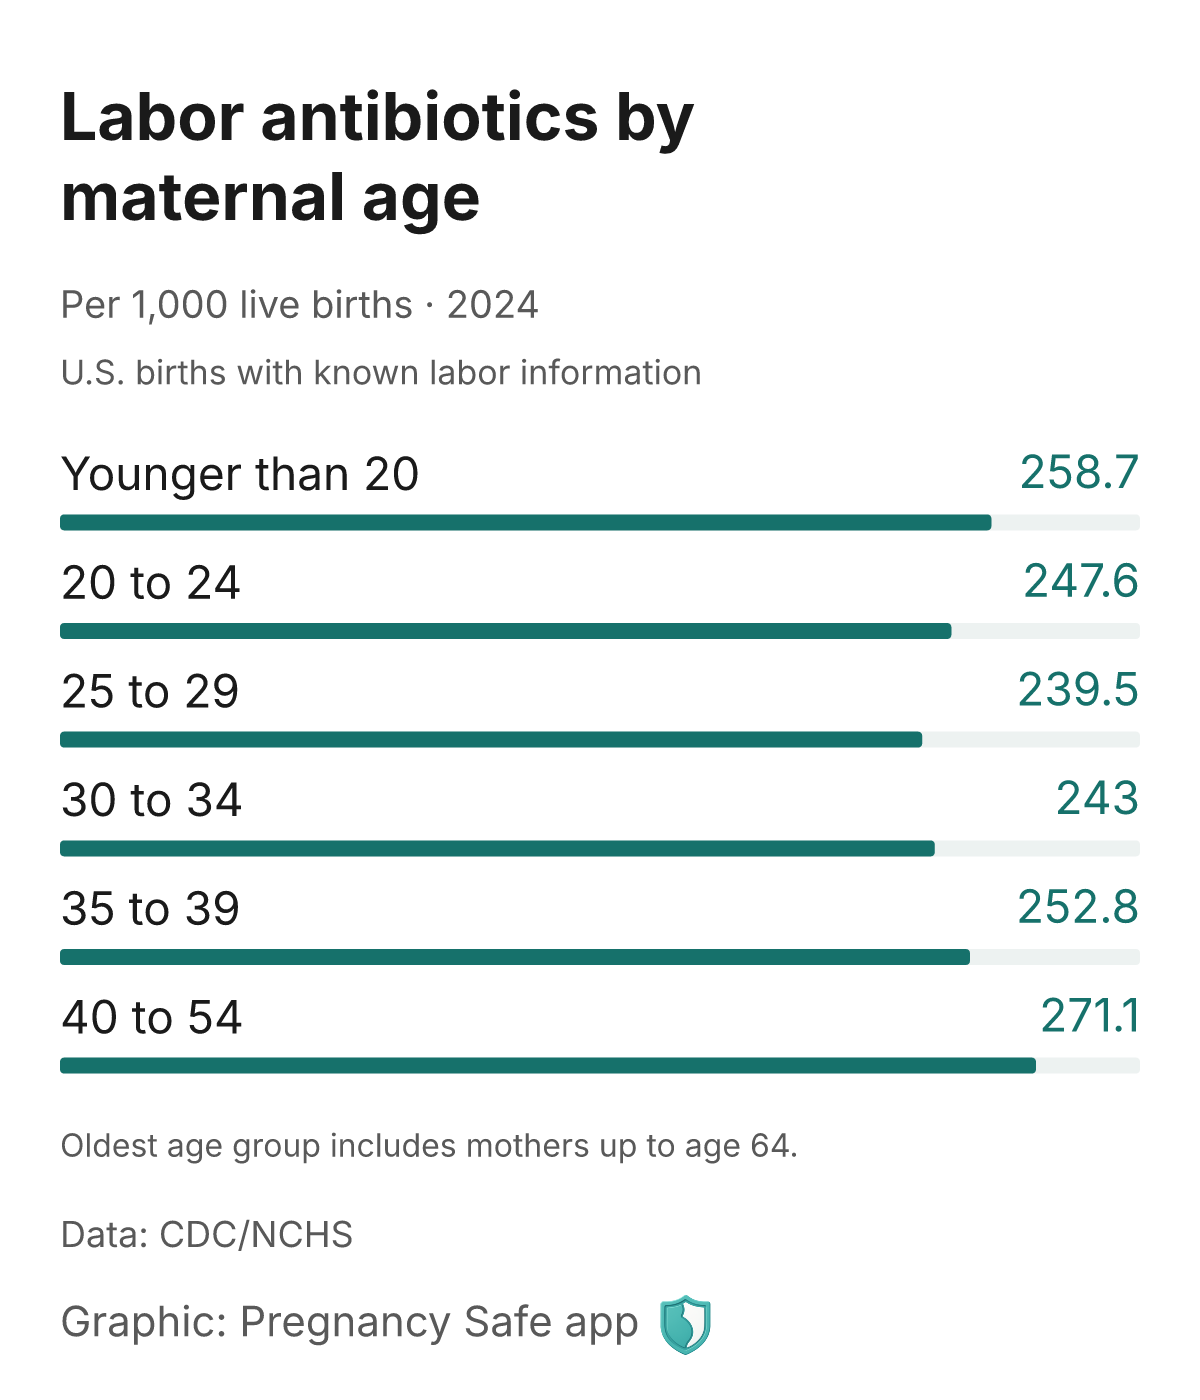
In 2024 U.S. birth records, maternal antibiotic receipt during labor was recorded for 246.3 per 1,000 live births with known labor characteristic information.
Source: CDC, National Center for Health Statistics (NCHS)
Download imageNICU admissions by maternal age
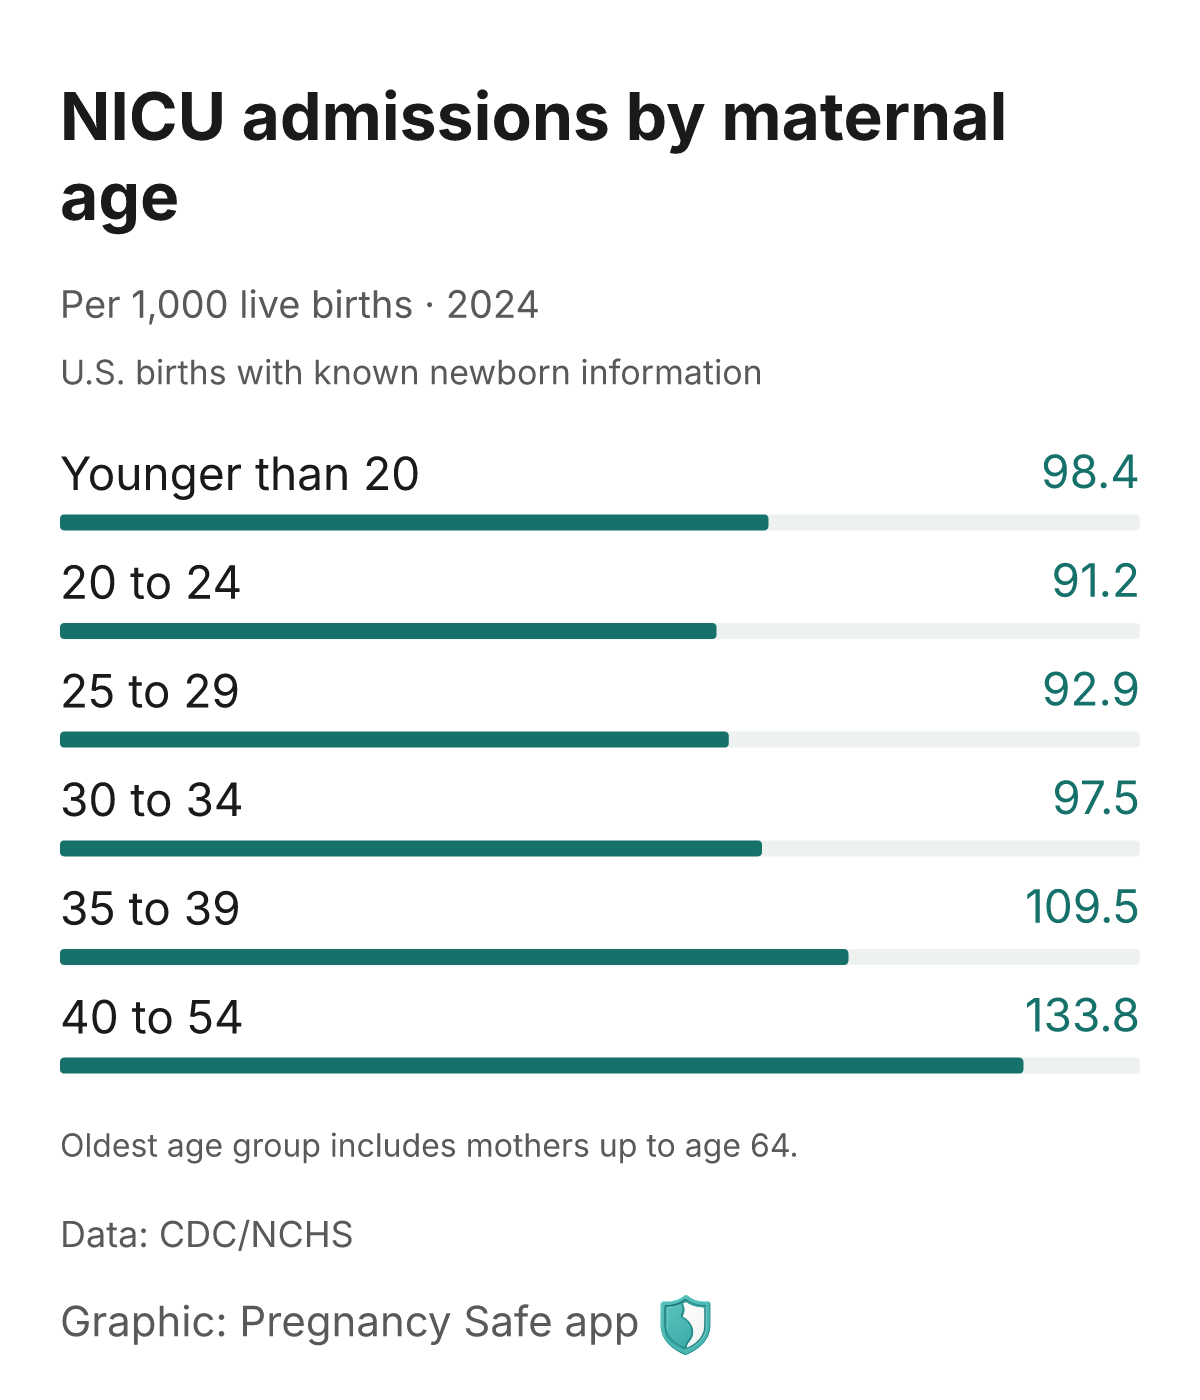
In 2024 U.S. birth records, NICU admission was recorded for 98.8 per 1,000 live births with known newborn condition information.
Source: CDC, National Center for Health Statistics (NCHS)
Download imageU.S. breastfeeding initiation and continuation
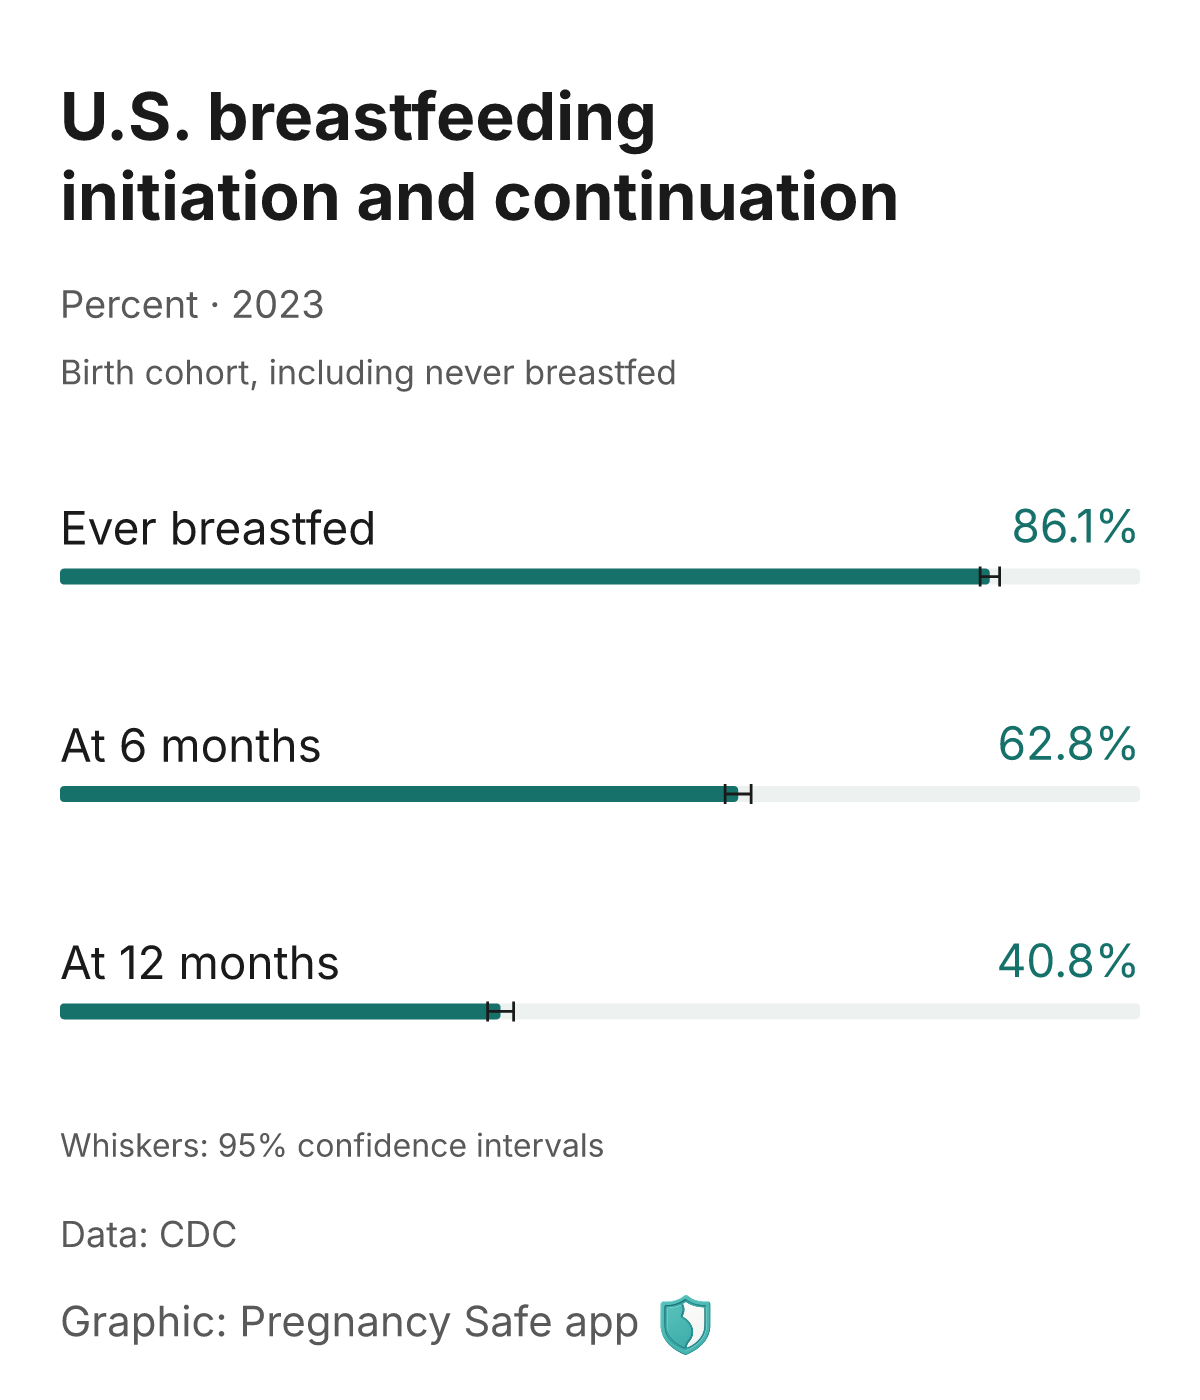
For U.S. children born in 2023, CDC estimated 86.1% were ever breastfed, 62.8% were breastfed at 6 months and 40.8% at 12 months.
Source: CDC, National Center for Chronic Disease Prevention and Health Promotion
Download imagePregnancy exposures and vaccination
Cigarette smoking during pregnancy
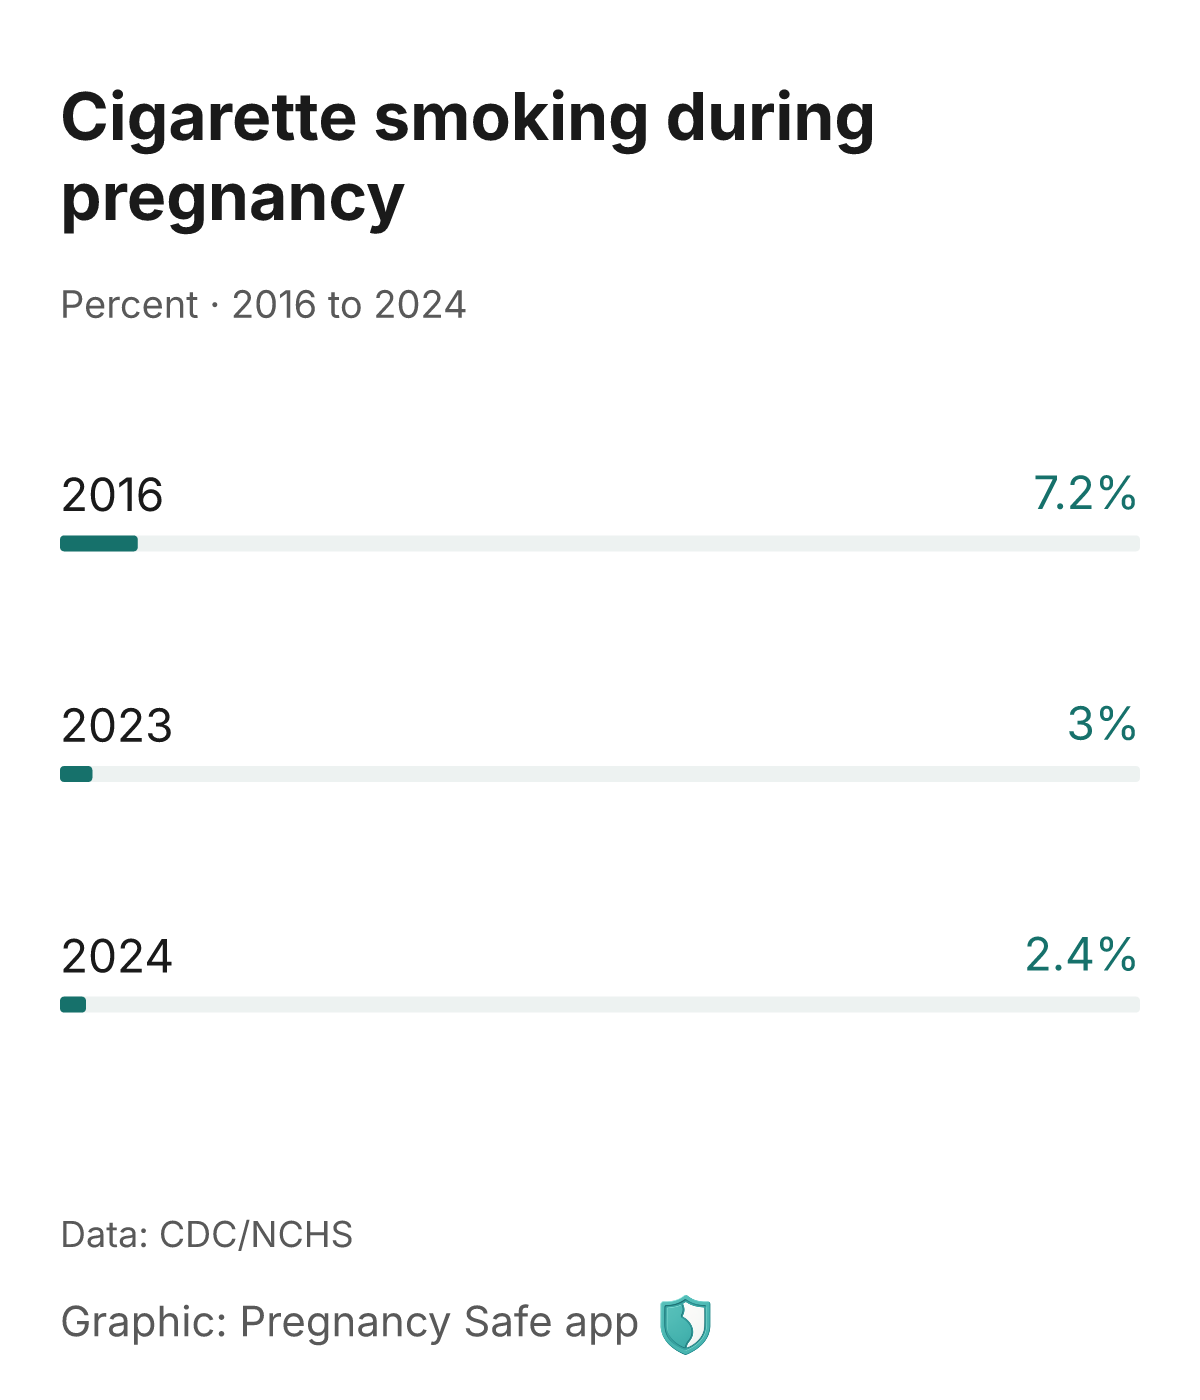
Among 2024 U.S. live birth records with known maternal smoking status, 2.4% indicated cigarette smoking at some time during pregnancy.
Source: CDC, National Center for Health Statistics (NCHS)
Download imageAlcohol use during pregnancy
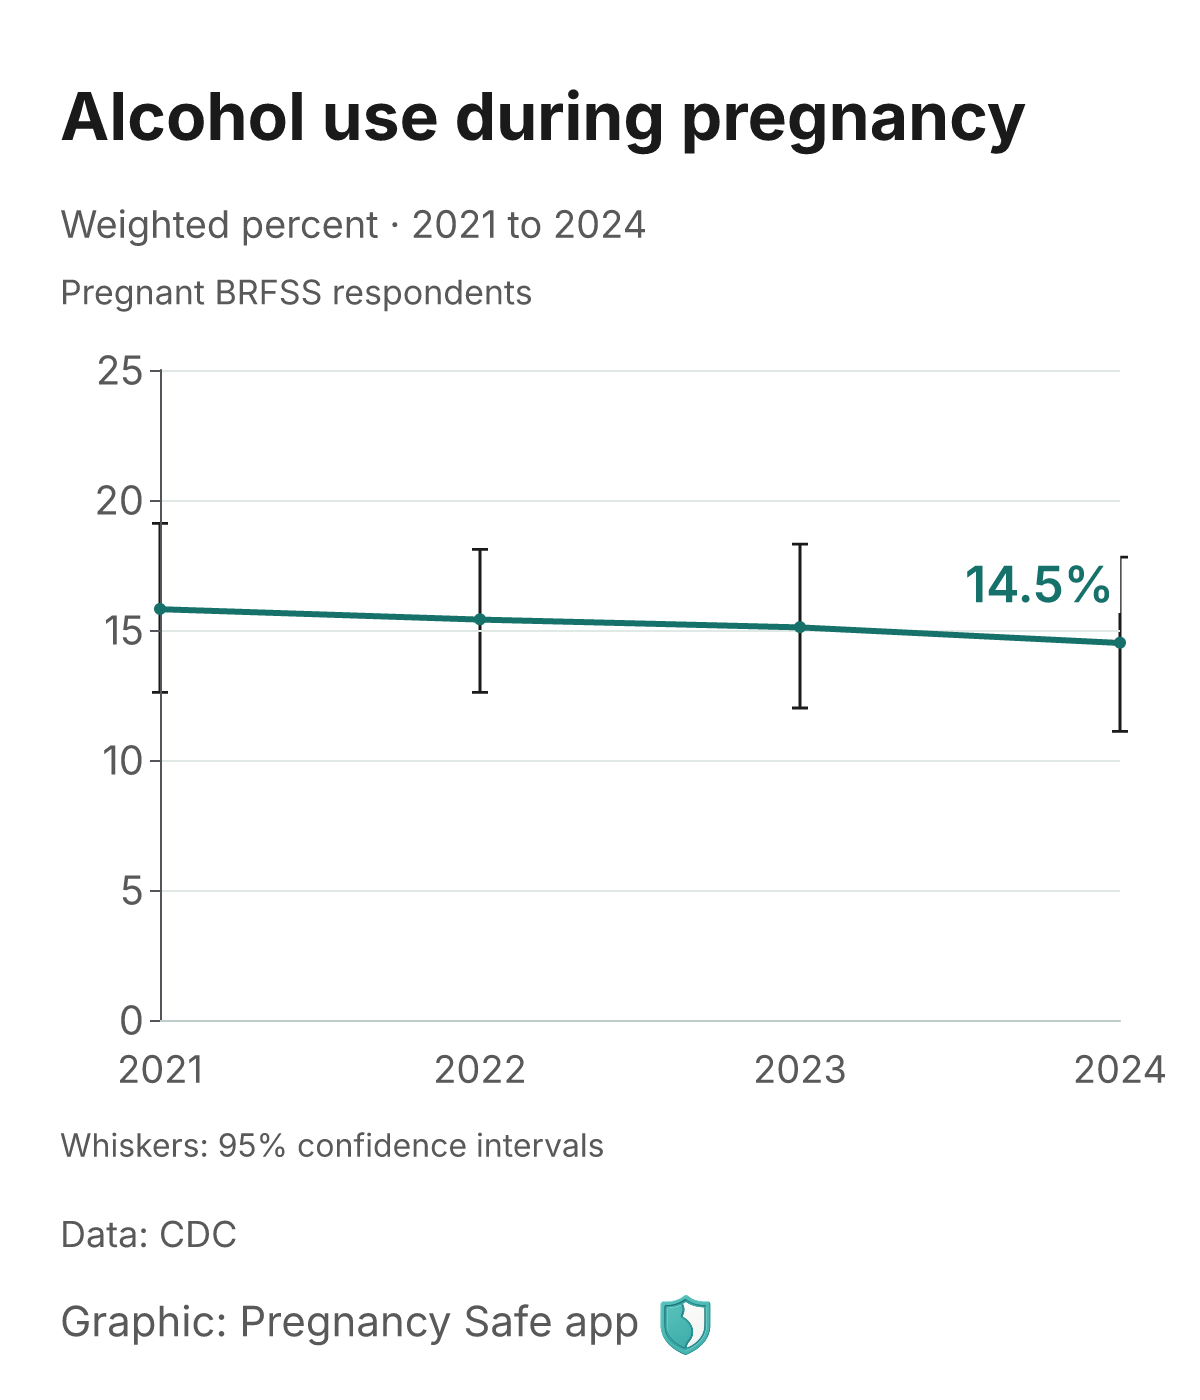
In pooled 2021 to 2024 BRFSS data, 15.2% of currently pregnant respondents ages 18 to 49 reported at least one alcoholic drink in the past 30 days (95% CI 13.6 to 16.8).
Source: CDC, MMWR
Download imageBinge drinking during pregnancy
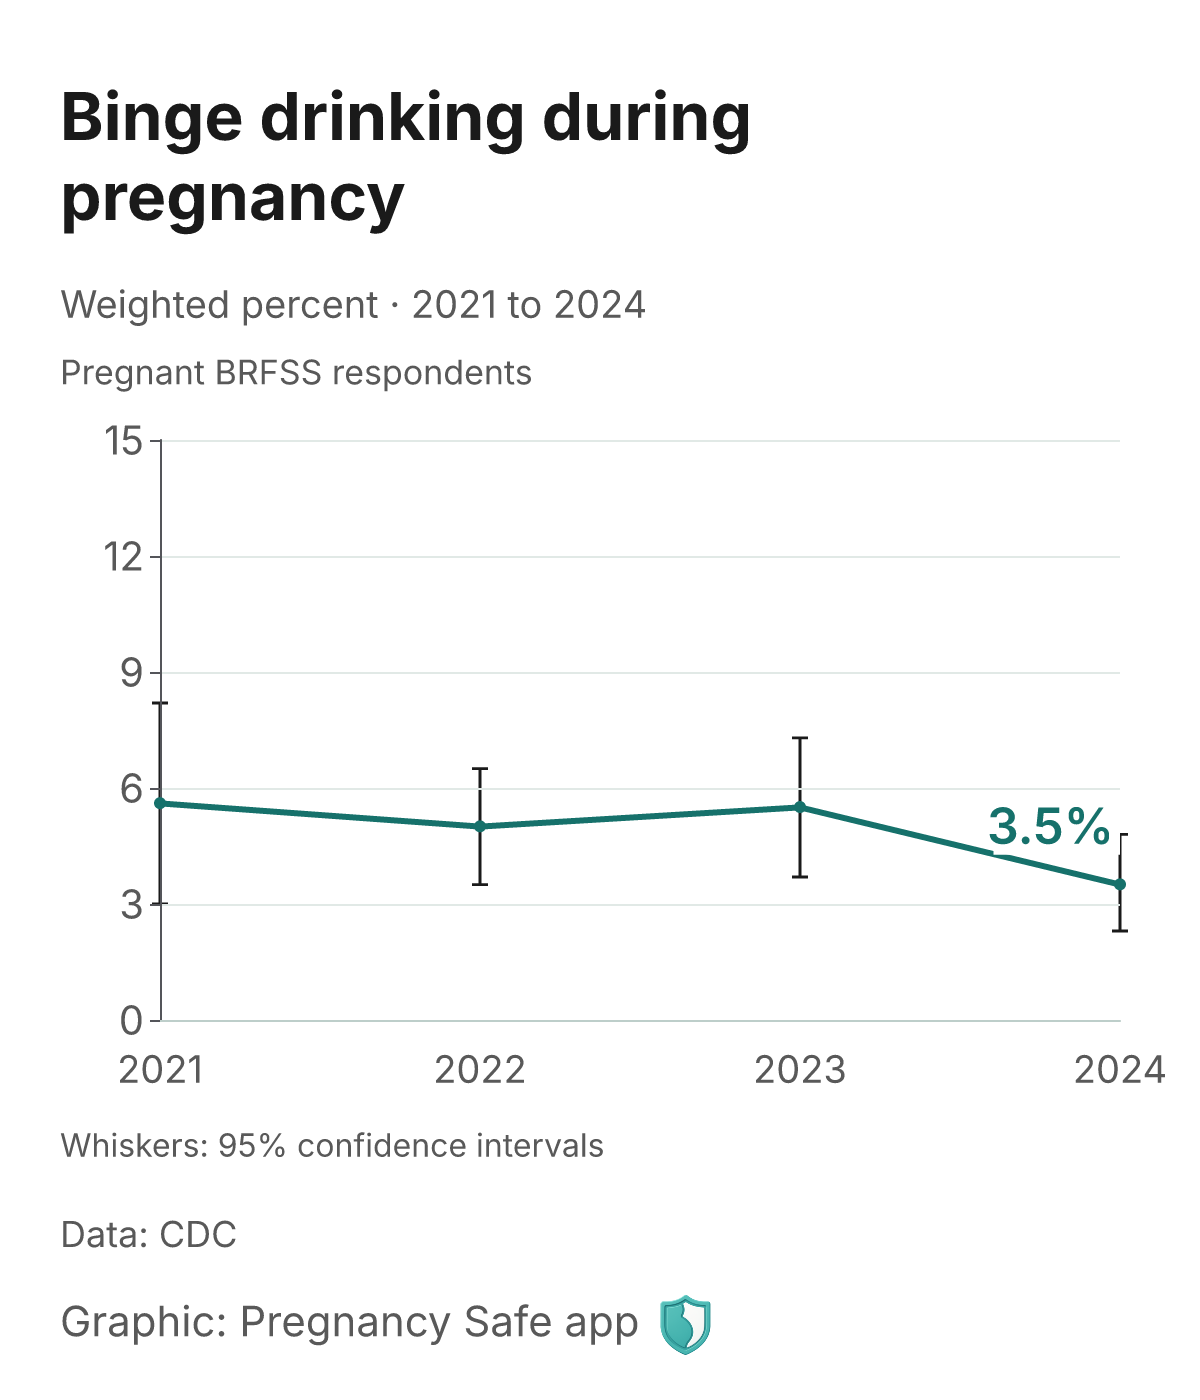
In pooled 2021 to 2024 BRFSS data, 4.9% of currently pregnant respondents ages 18 to 49 reported four or more alcoholic drinks on at least one occasion in the past 30 days (95% CI 4.0 to 5.8).
Source: CDC, MMWR
Download imagePrescription opioid use during pregnancy
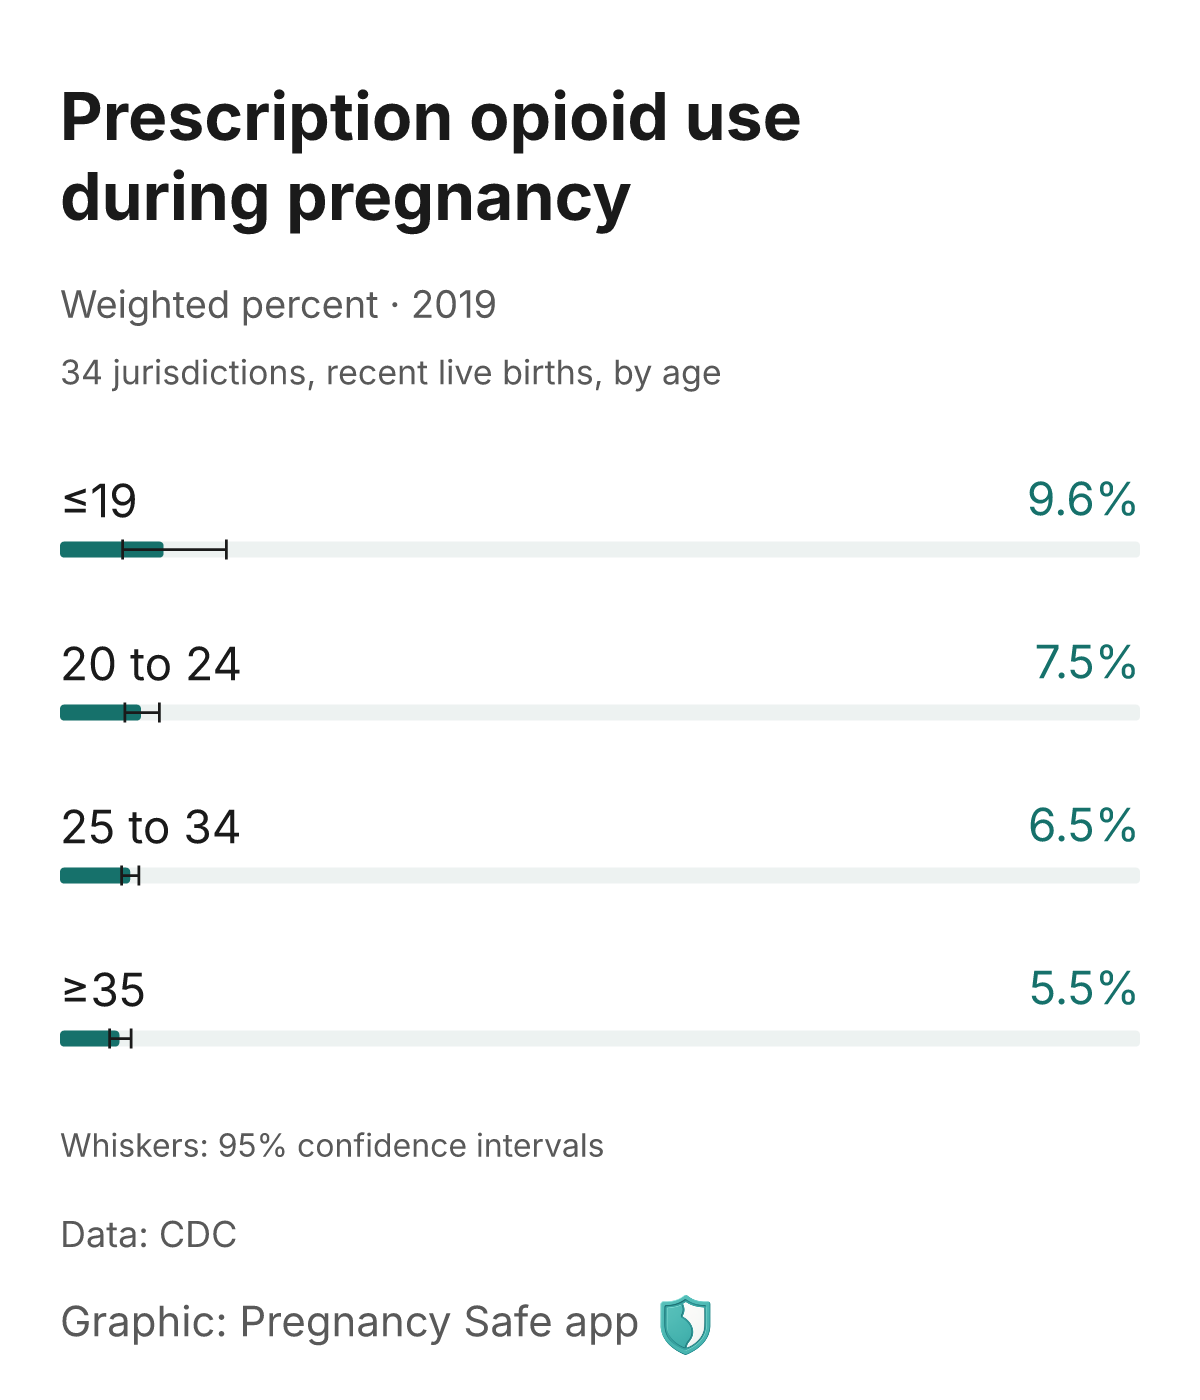
In a 2019 survey of women with recent live births in 34 U.S. jurisdictions, 6.6% reported prescription opioid pain reliever use during pregnancy.
Source: CDC
Download imageFlu vaccination by maternal age
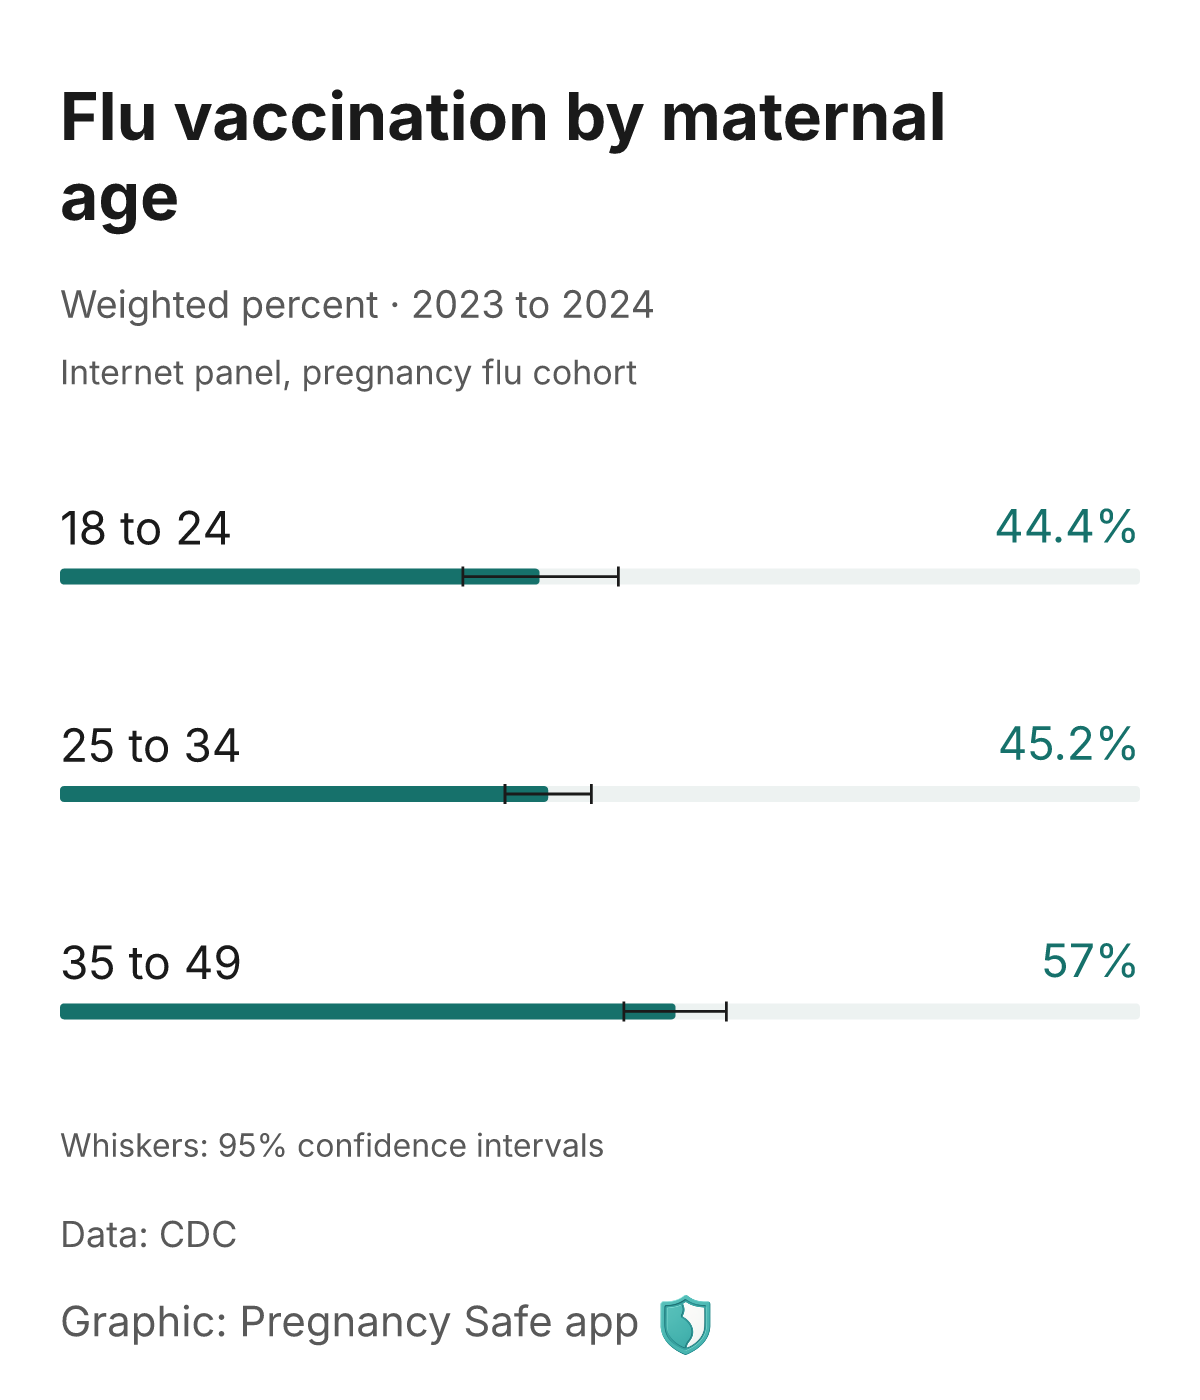
In the April 2024 Internet panel survey, 47.4% of women pregnant during October 2023 through January 2024 reported flu vaccination before or during pregnancy.
Source: CDC
Download imageTdap vaccination by maternal age
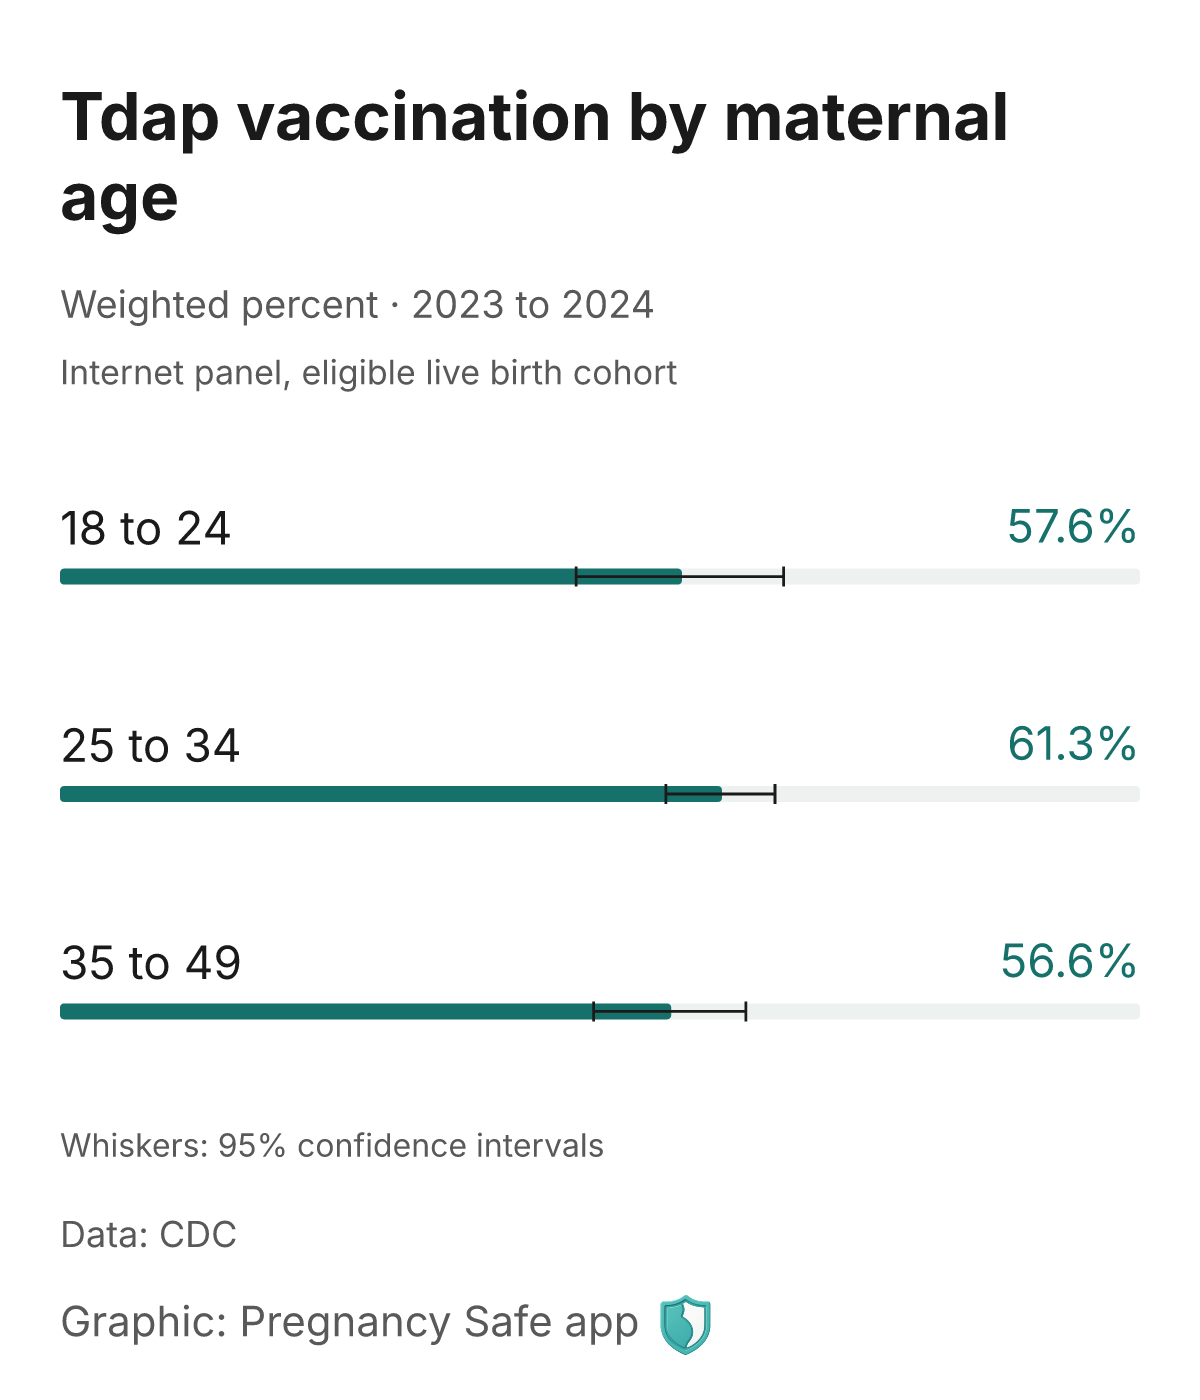
In the April 2024 Internet panel survey, 59.6% of eligible women with a recent live birth reported Tdap vaccination during that pregnancy.
Source: CDC
Download imageUpdated COVID 19 vaccination by age
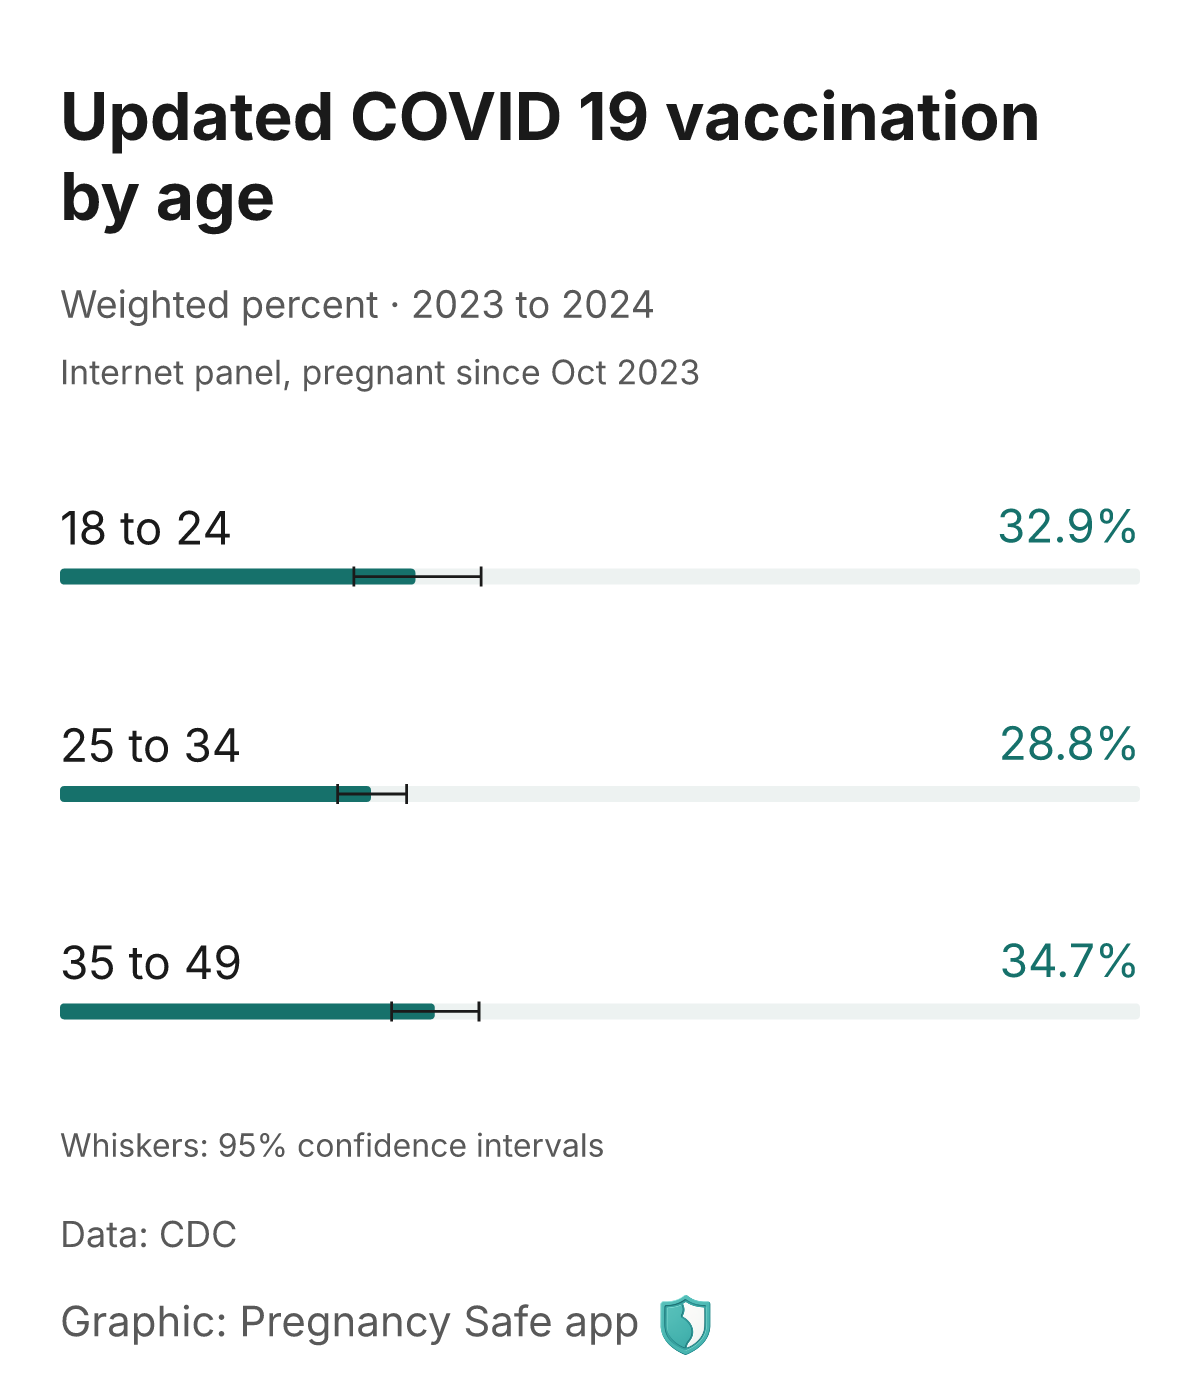
In the April 2024 Internet panel survey, 30.9% of women pregnant since October 2023 reported receiving an updated 2023 to 2024 COVID 19 vaccine before or during pregnancy.
Source: CDC
Download imageOpioid counseling by previous births
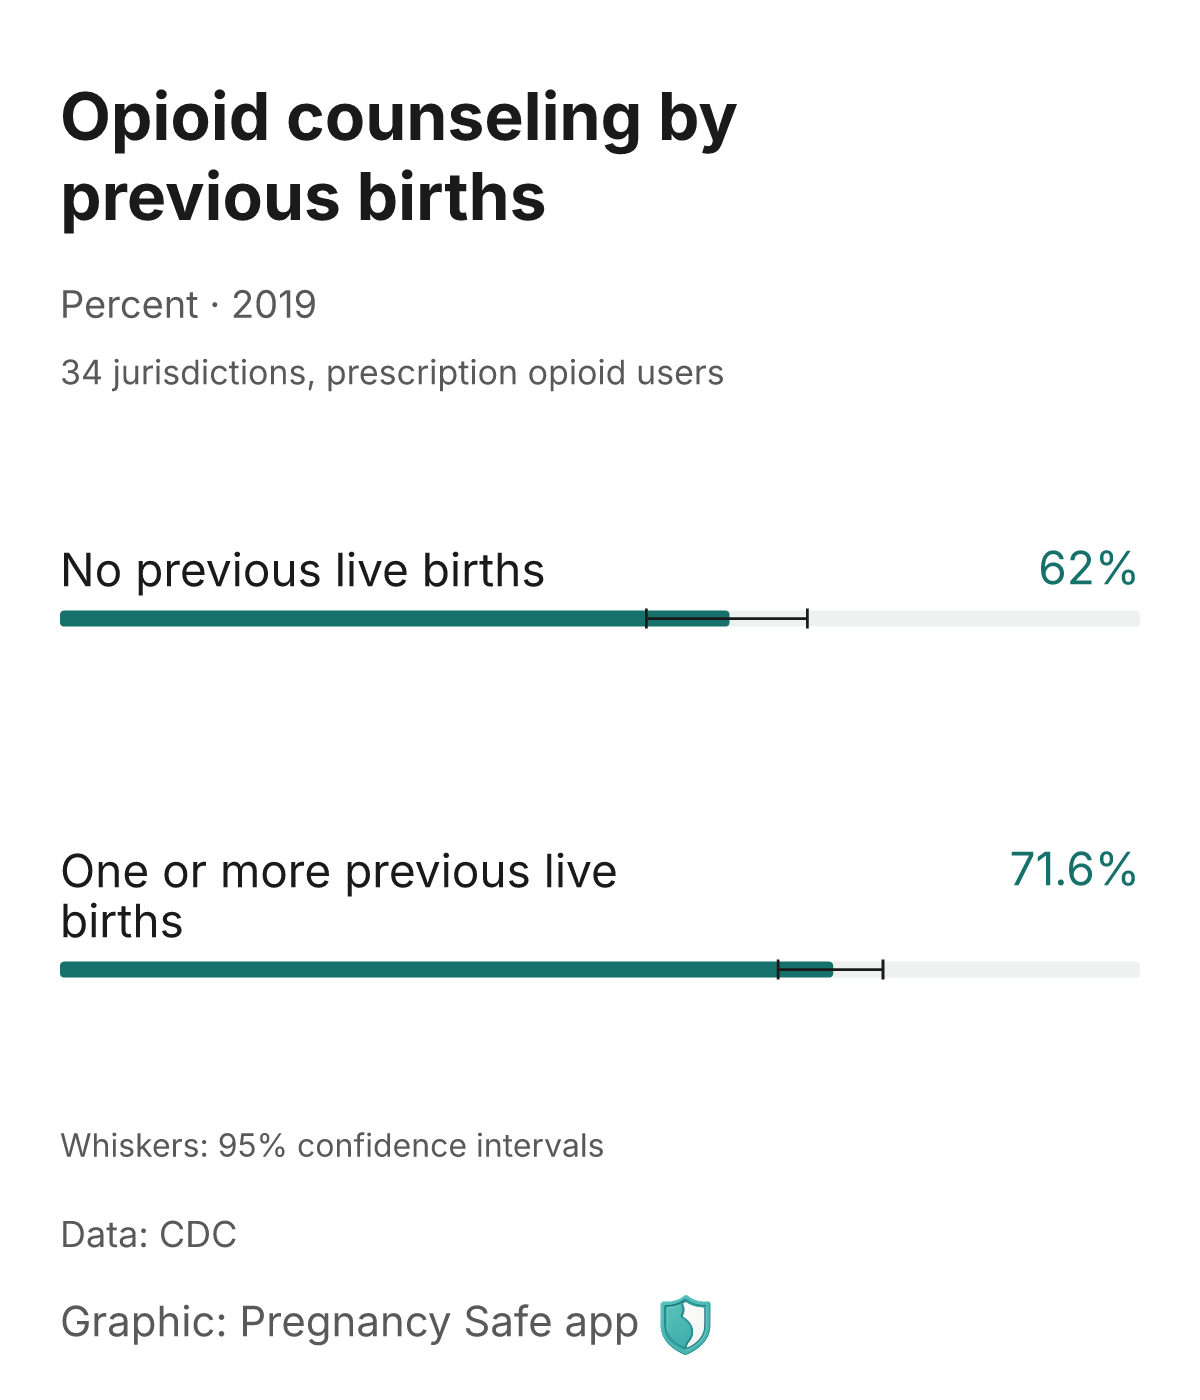
Among prescription opioid users with a recent live birth in the 2019 34 jurisdiction study, 68.1% reported provider counseling about how opioid use during pregnancy could affect the baby.
Source: CDC
Download imageCigarette and e cigarette use in pregnancy
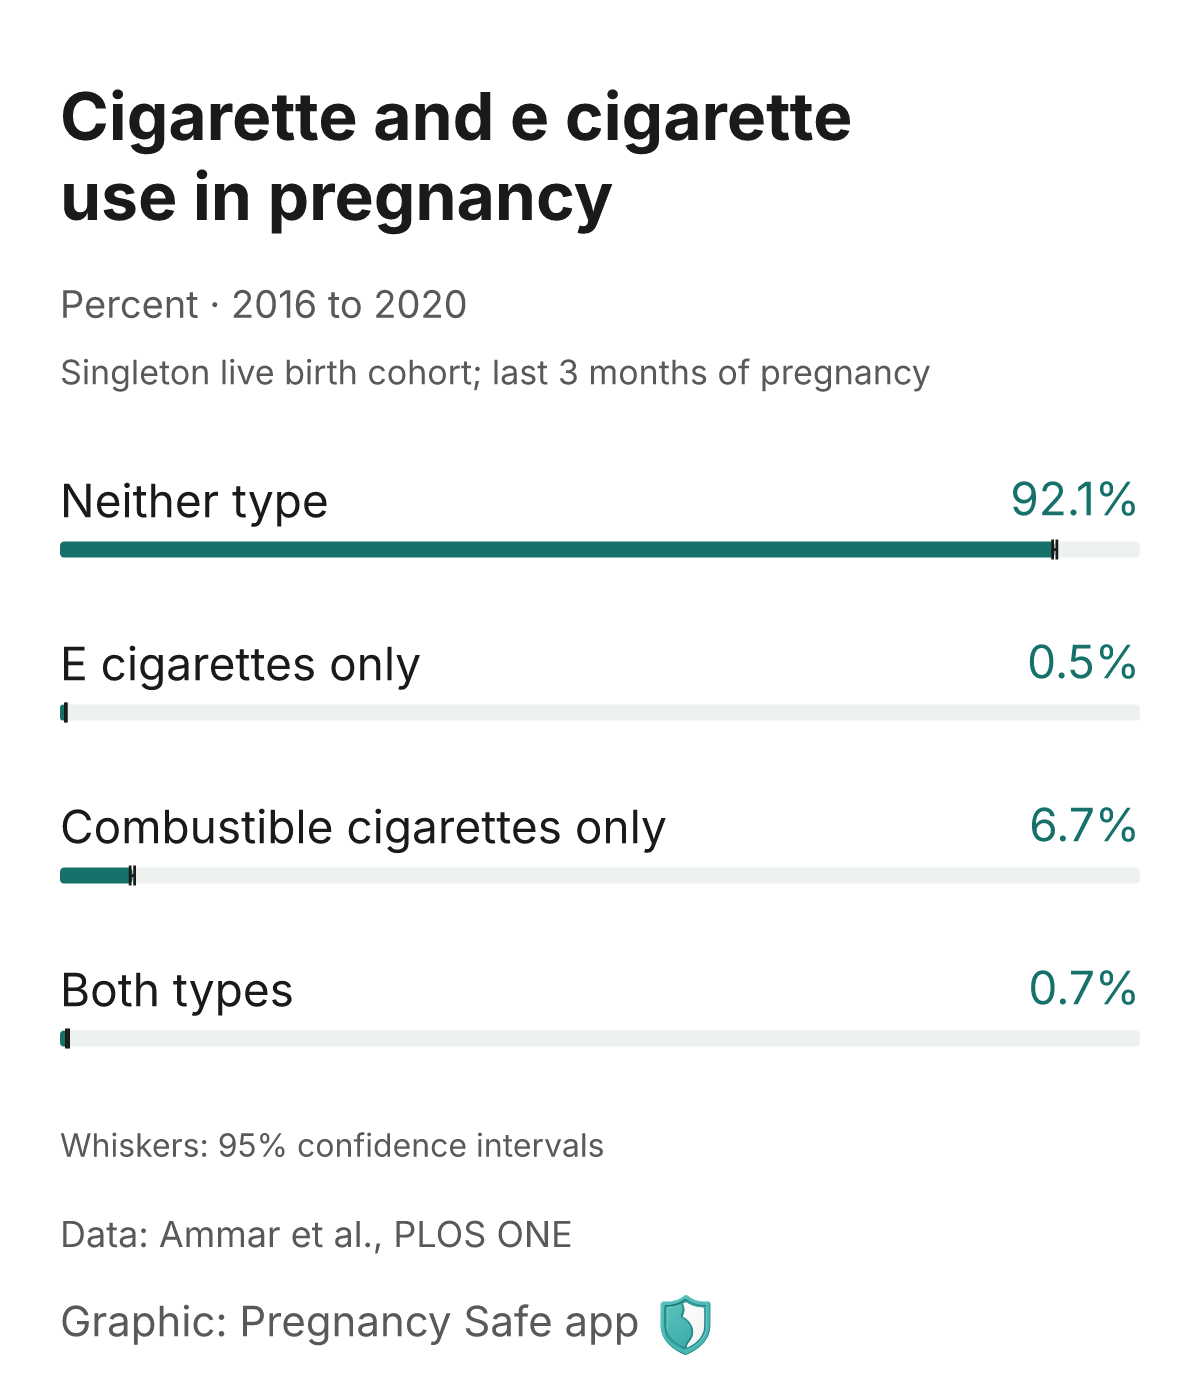
In Ammar and colleagues’ 2016 to 2020 PRAMS analysis of women with singleton live births, 0.5% reported e cigarette use without combustible cigarette use during the last three months of pregnancy.
Source: Ammar et al., PLOS ONE (original article archived in NIH/PMC; not an NIH endorsement)
Download imageFertility and family planning
Fertility services used in the U.S.
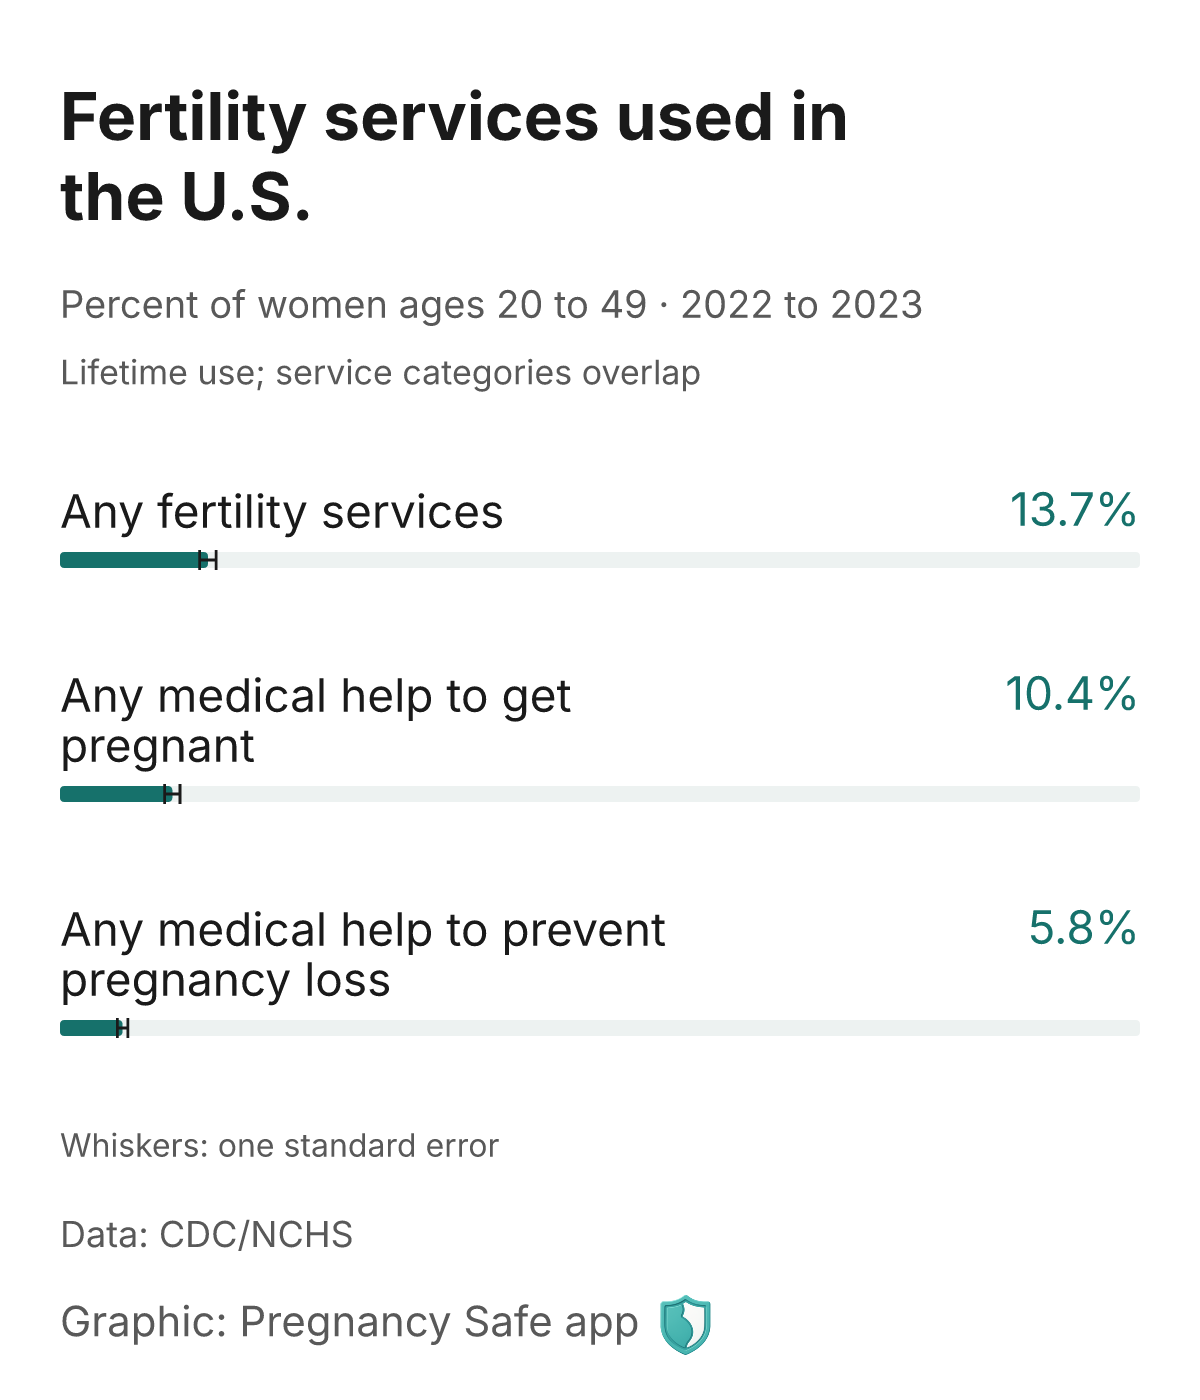
In the 2022 to 2023 NSFG, an estimated 13.7% of women ages 20 to 49 in U.S. households had ever used medical help to get pregnant or prevent pregnancy loss.
Source: CDC, National Center for Health Statistics (NCHS)
Download imageFertility services used to get pregnant
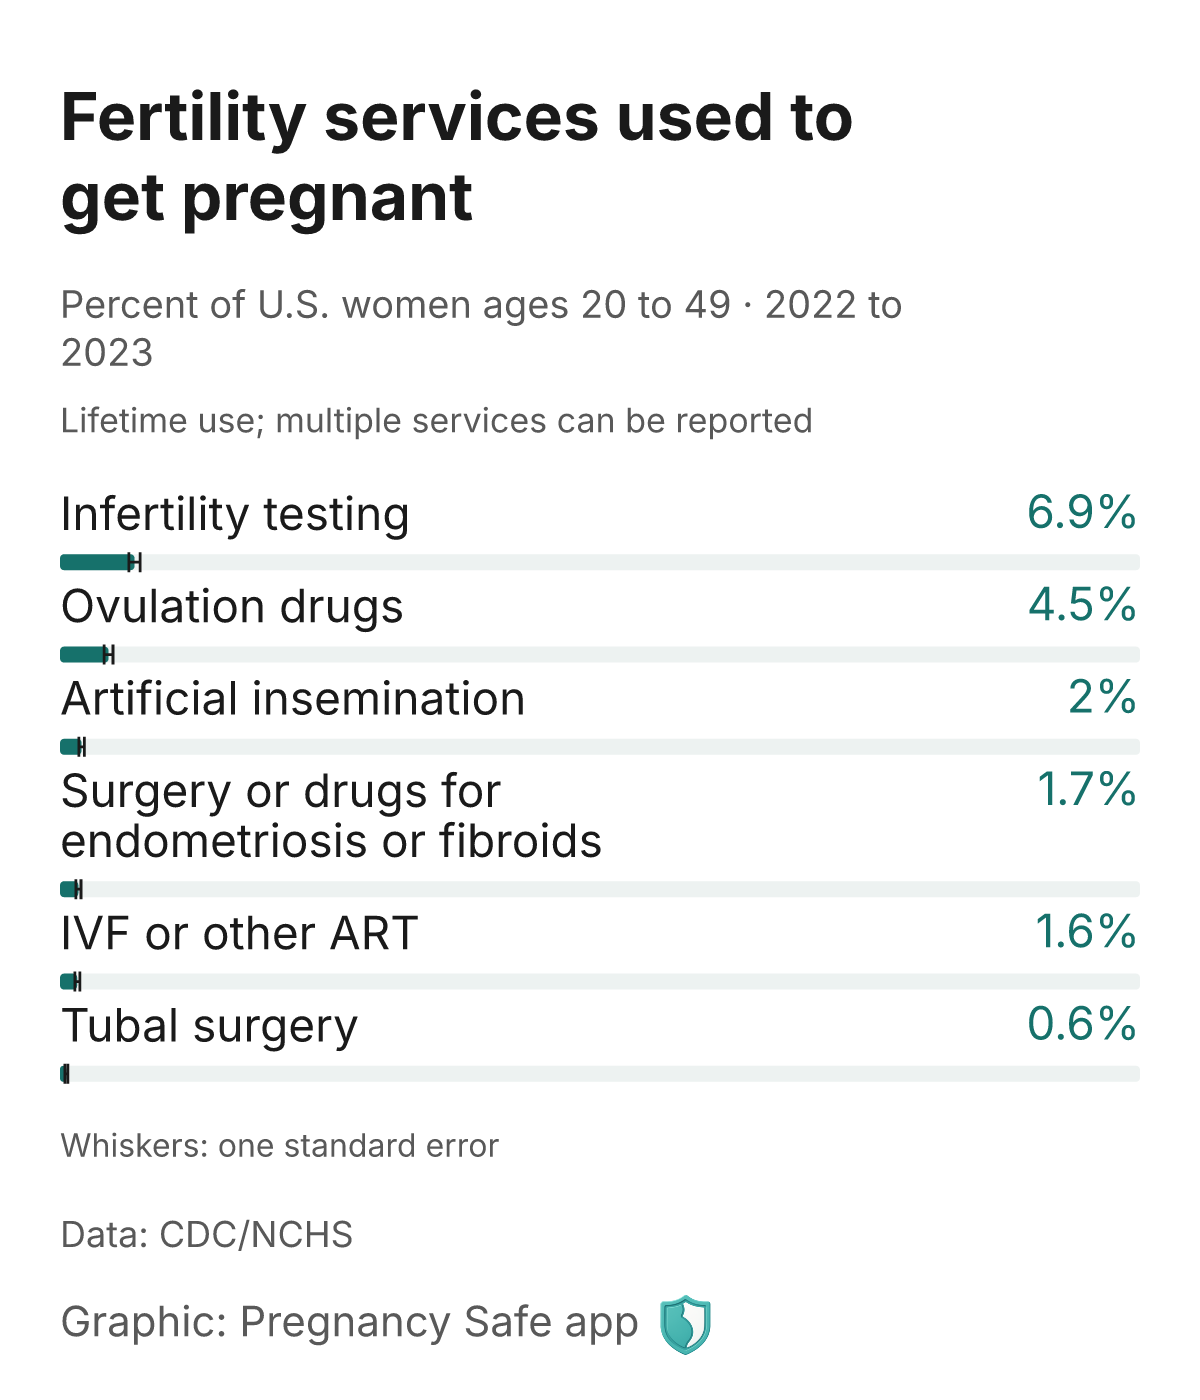
In the 2022 to 2023 NSFG, an estimated 1.6% of women ages 20 to 49 in U.S. households had ever used in vitro fertilization or other assisted reproductive technology procedures.
Source: CDC, National Center for Health Statistics (NCHS)
Download imageExpecting a future birth in the U.S.
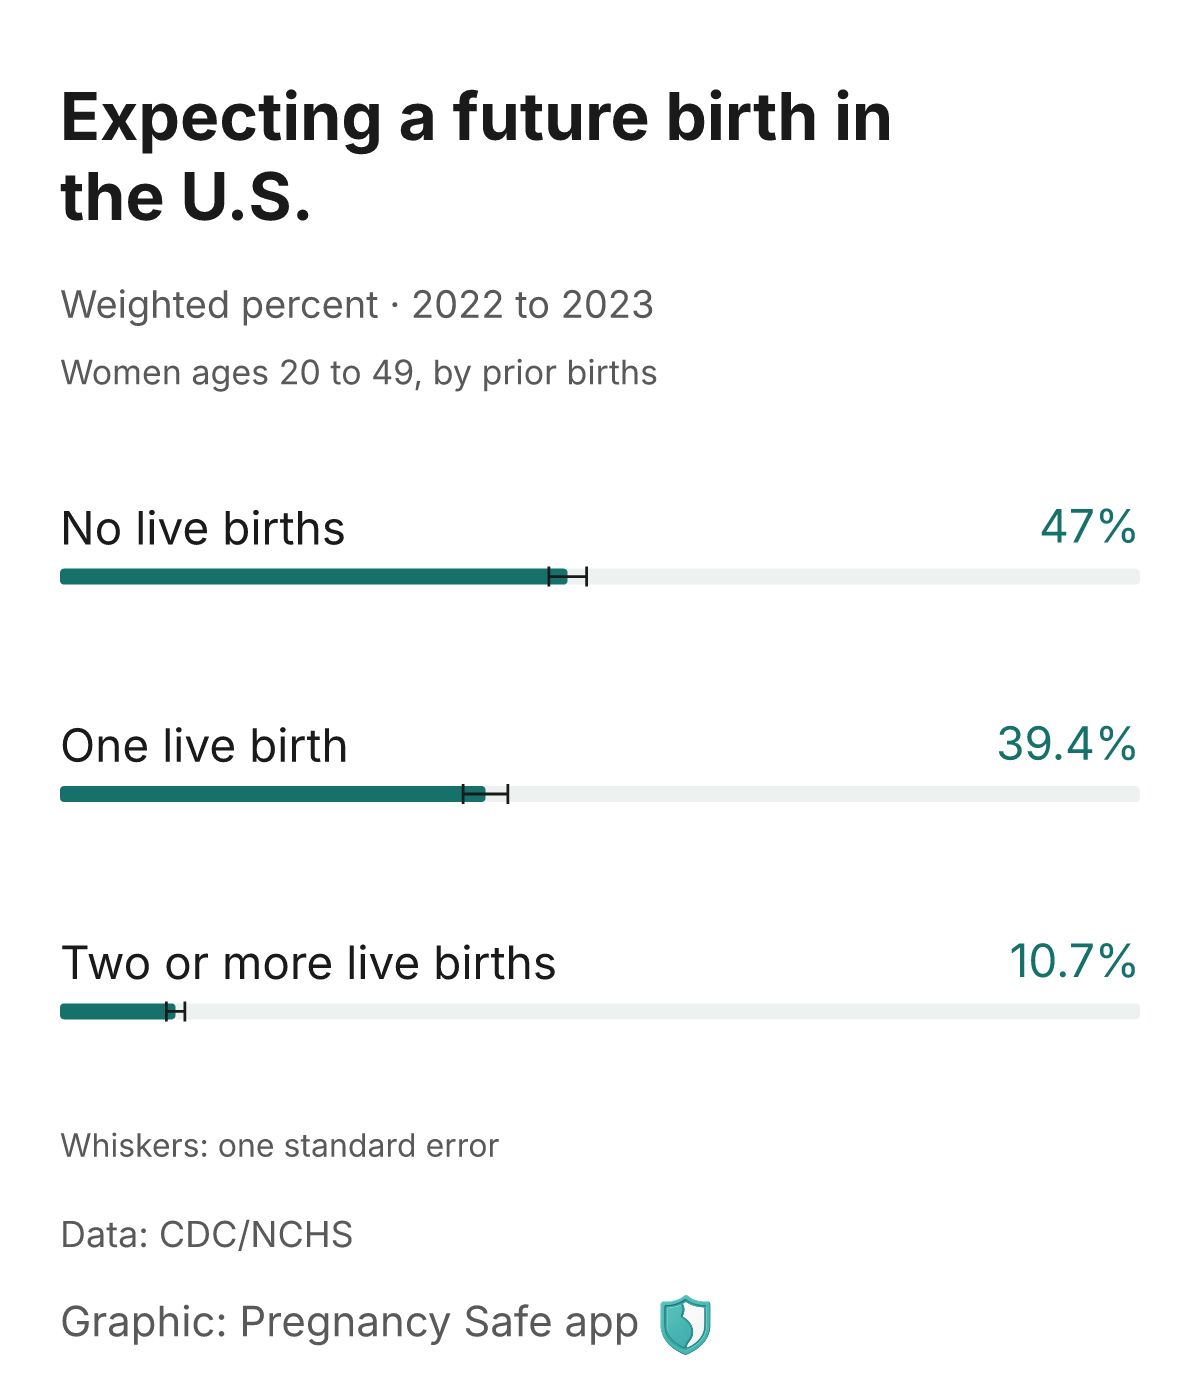
In the 2022 to 2023 NSFG, 30.8% of U.S. household women ages 20 to 49 expected a future birth; for currently pregnant respondents this referred to births after that pregnancy.
Source: CDC/NCHS
Download imageExpected timing of a first birth
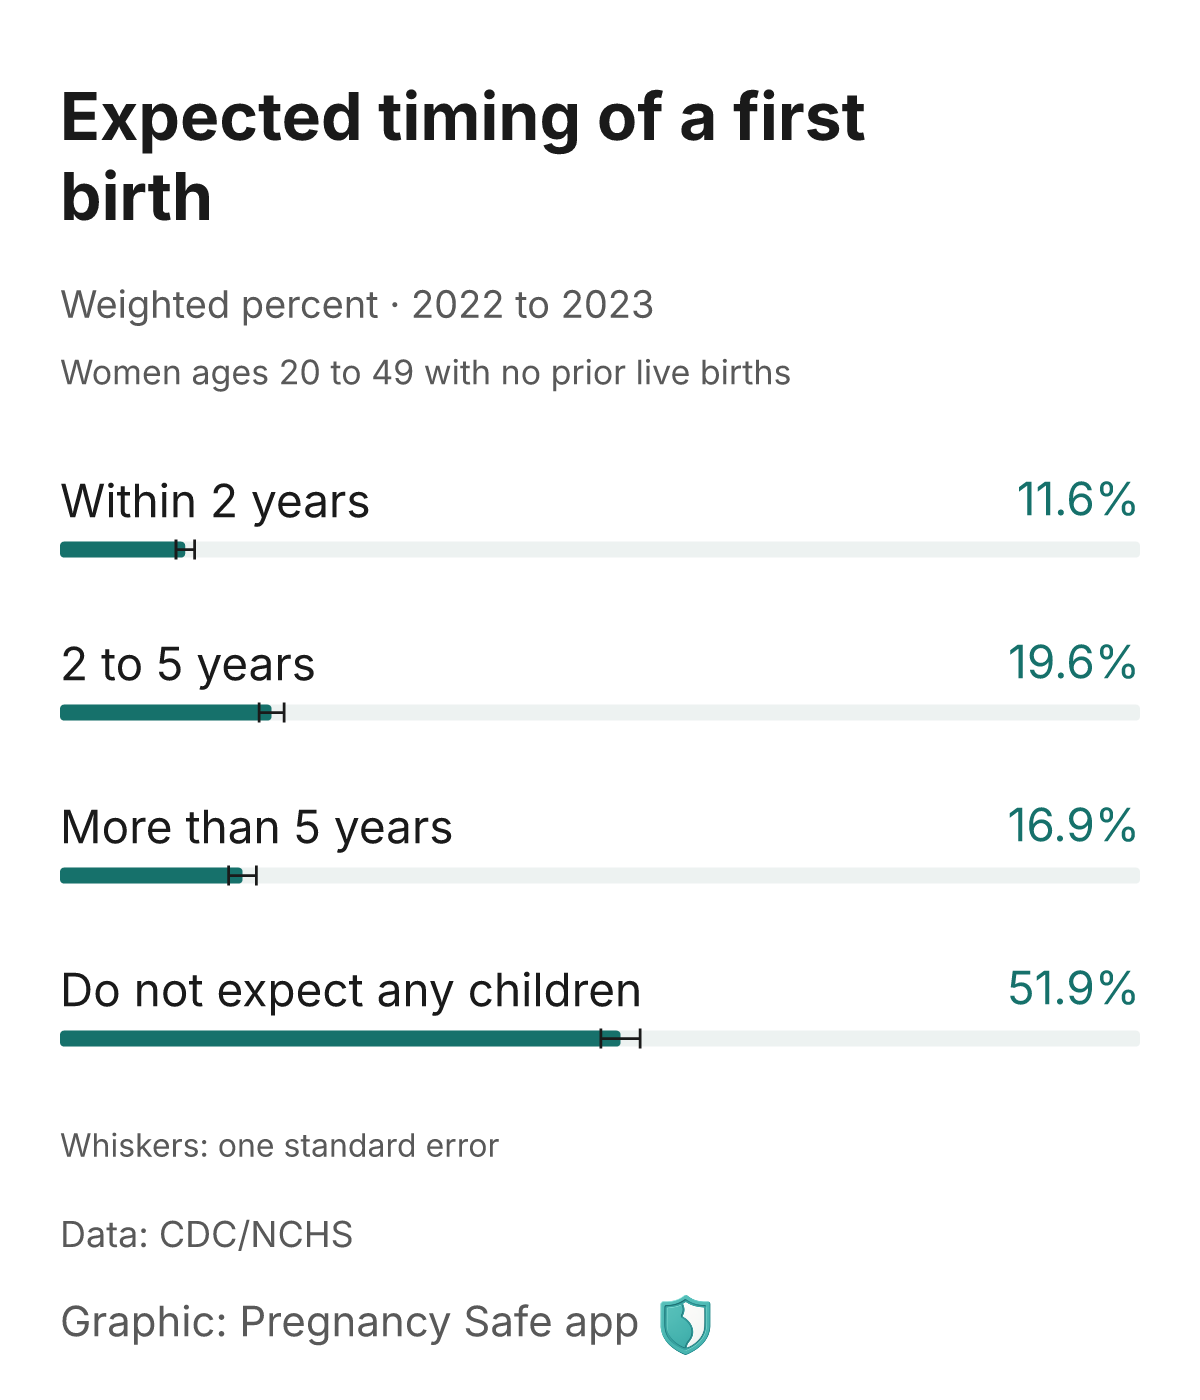
In NCHS’s 2022 to 2023 timing distribution for women ages 20 to 49 with no prior live births, 11.6% expected a first child within two years.
Source: CDC/NCHS
Download imageU.S. general fertility rate
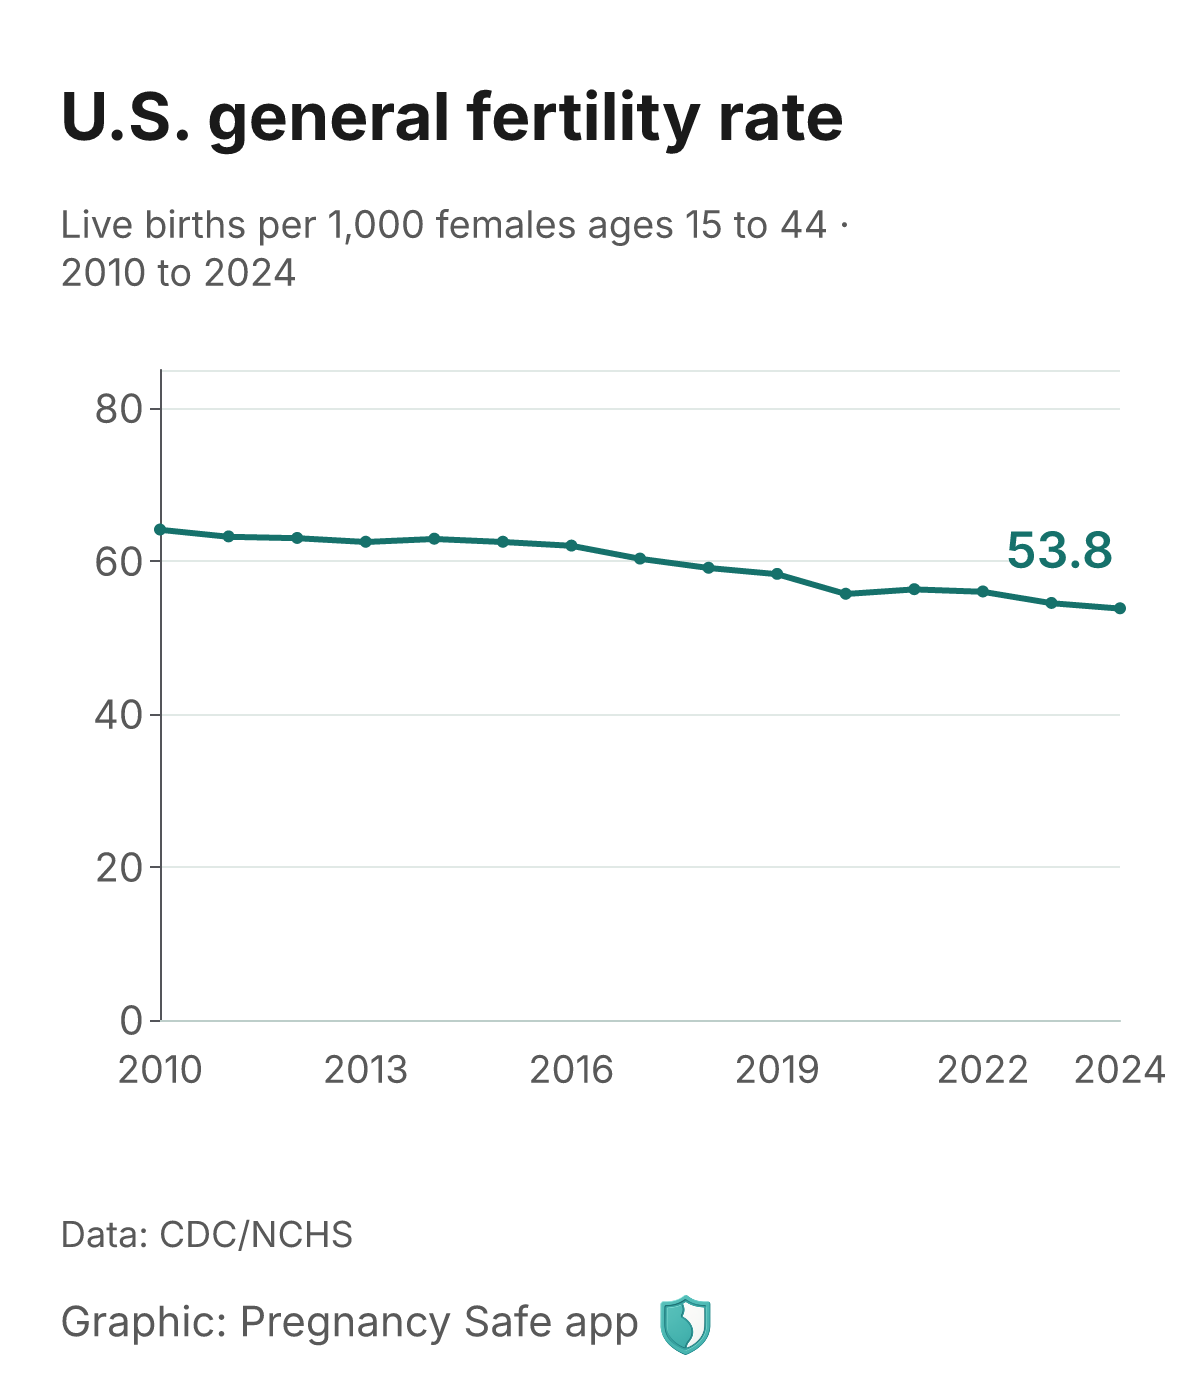
CDC/NCHS reported 53.8 U.S. live births per 1,000 females ages 15 to 44 in 2024, compared with 54.5 in 2023.
Source: CDC, National Center for Health Statistics (NCHS)
Download imageImpaired fecundity by age in the U.S.
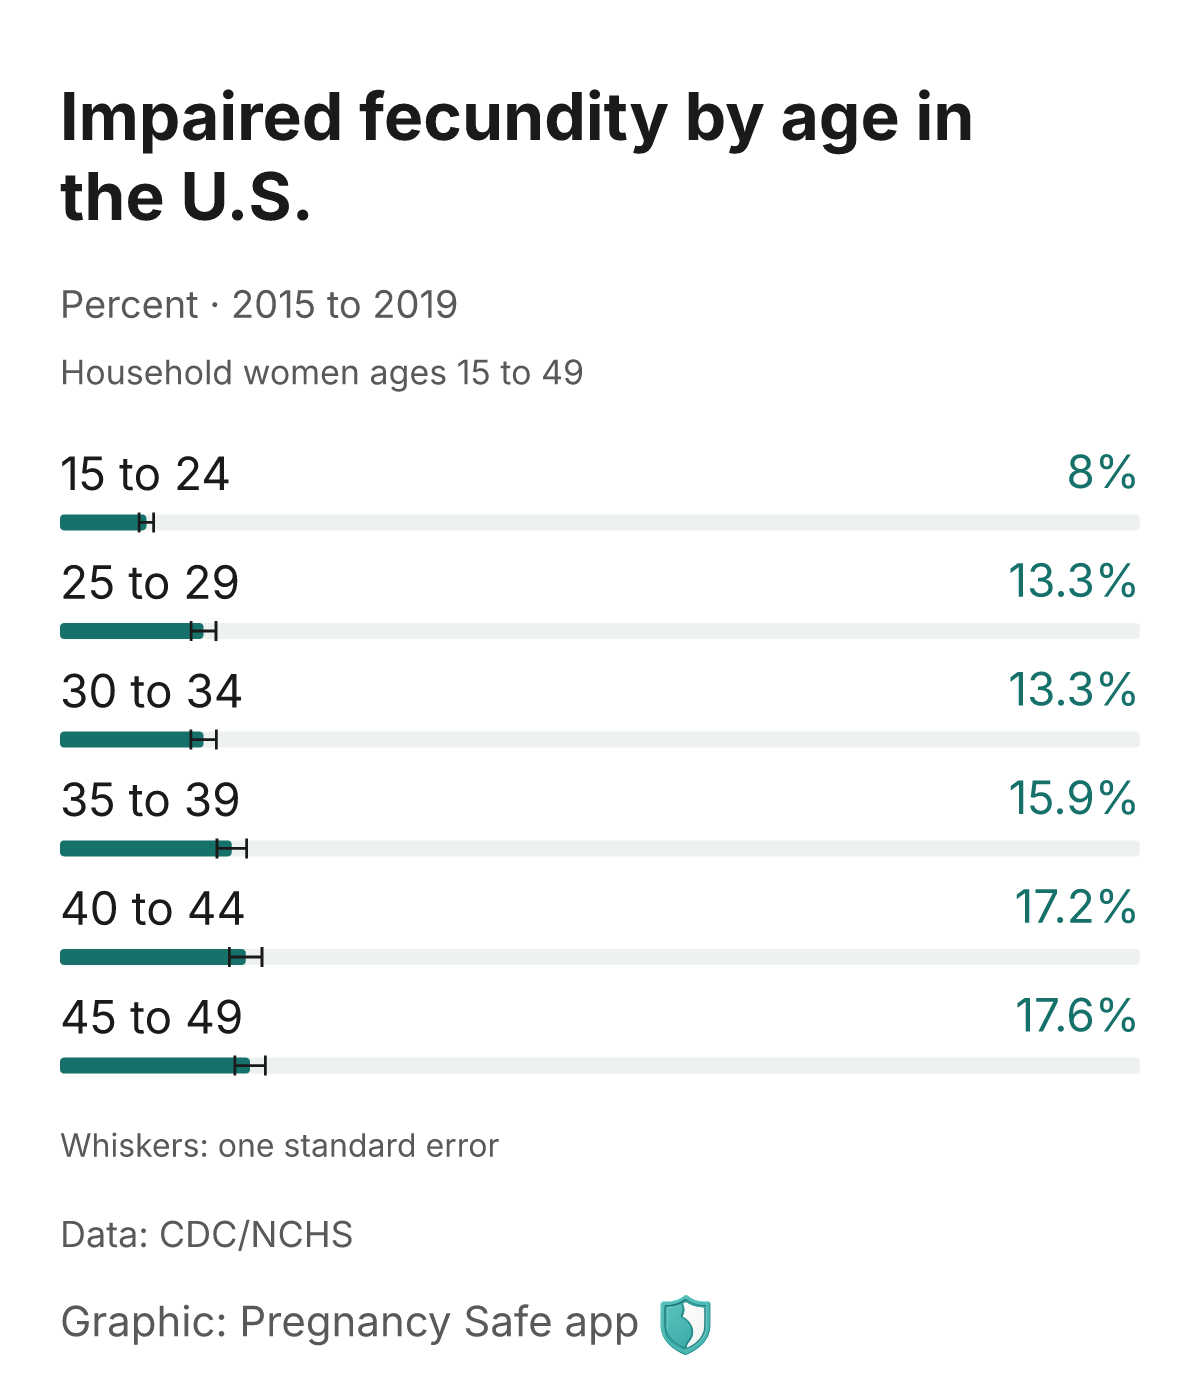
In the 2015 to 2019 NSFG, 13.4% of U.S. household women ages 15 to 49 had impaired fecundity, survey defined difficulty conceiving or carrying a pregnancy to live birth.
Source: CDC/NCHS
Download imageInfertility among married women by age
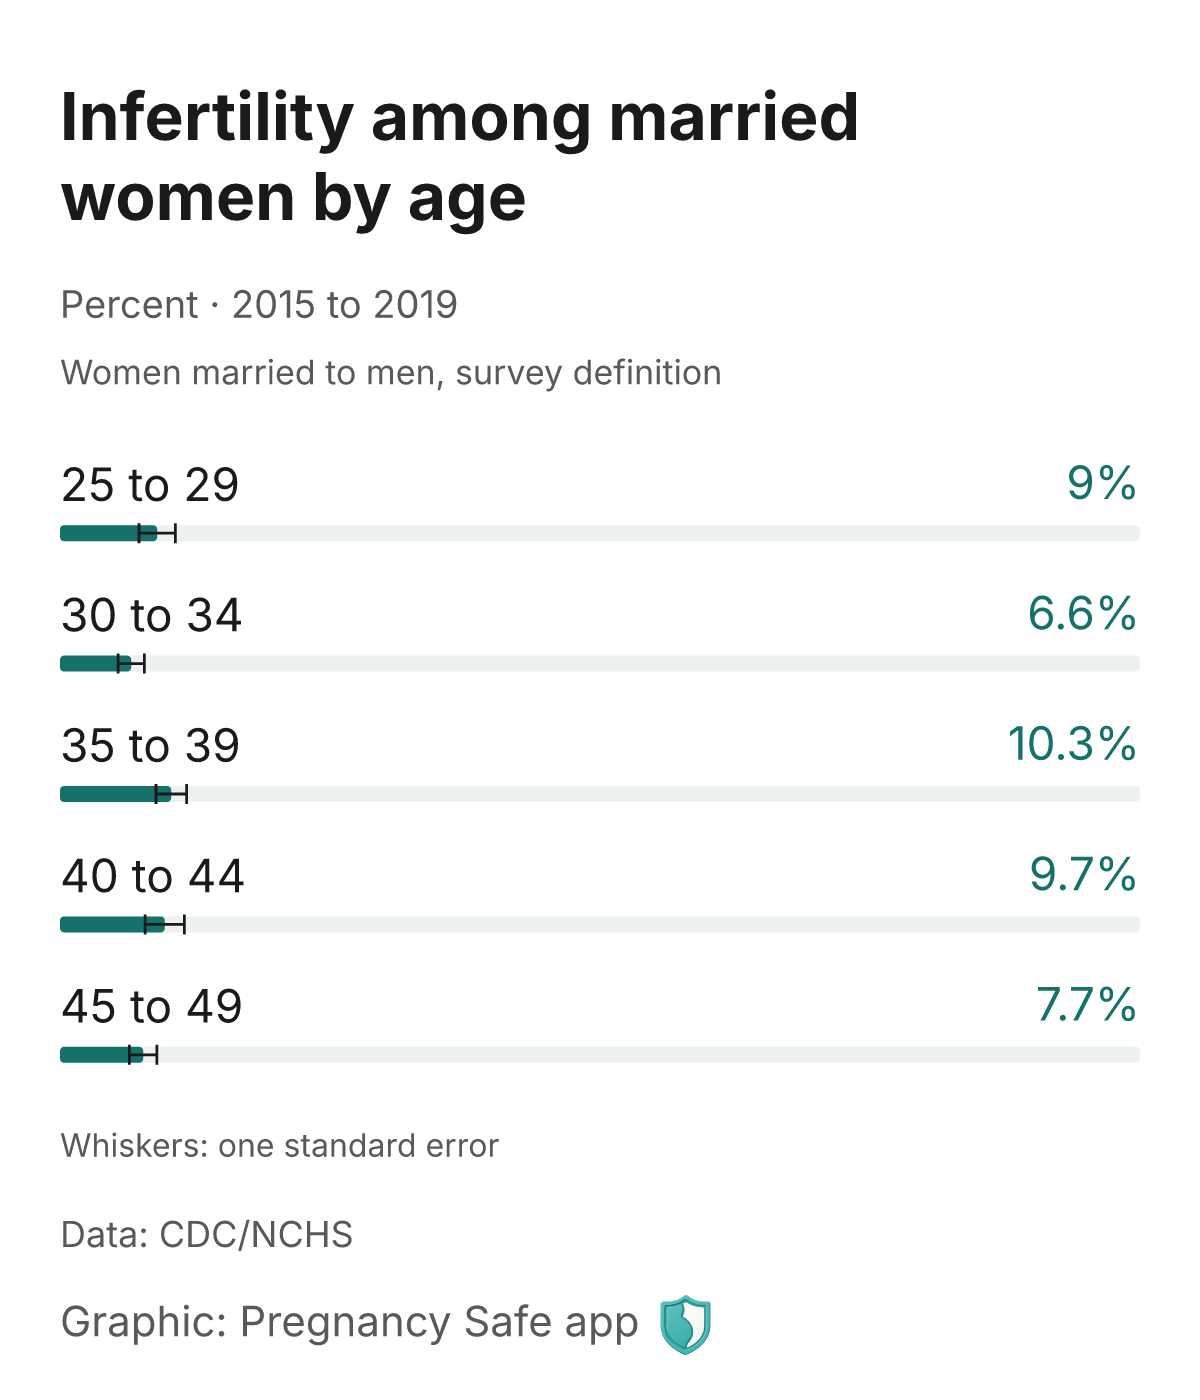
In the 2015 to 2019 NSFG, 8.5% of U.S. household women ages 15 to 49 married to men met the survey definition of 12 month infertility.
Source: CDC/NCHS
Download imagePostpartum and maternal mortality
U.S. maternal mortality rate
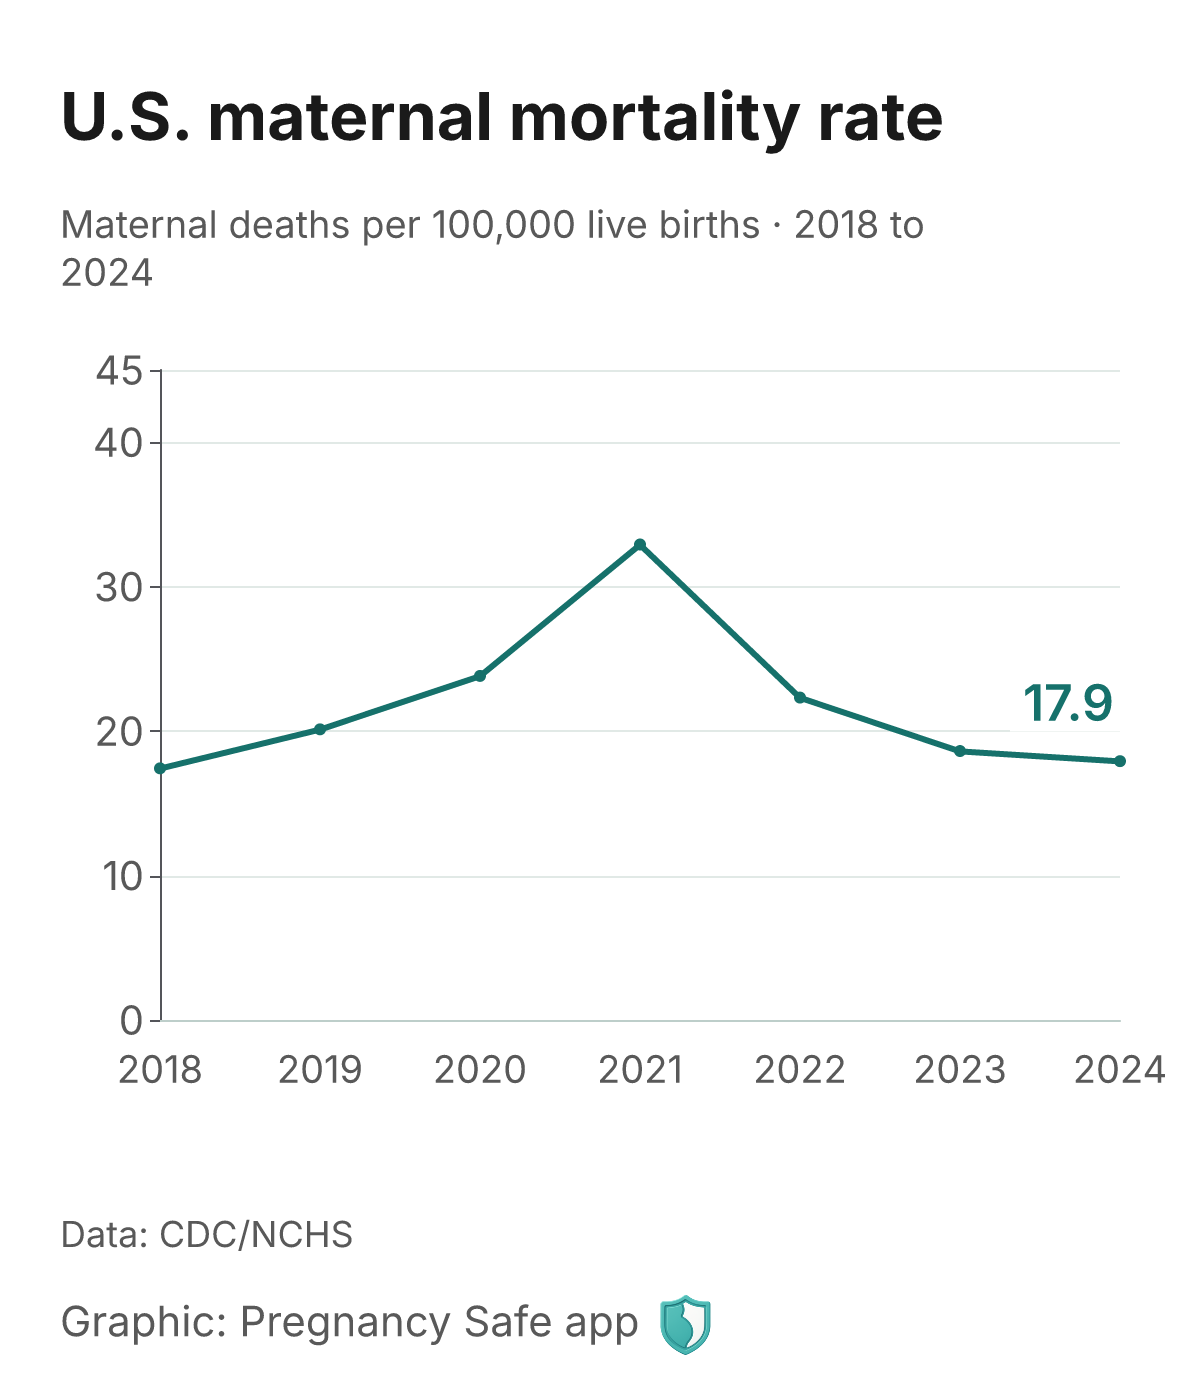
In 2024, the U.S. maternal mortality rate was 17.9 maternal deaths per 100,000 live births (649 maternal deaths).
Source: CDC, National Center for Health Statistics (NCHS)
Download imageMaternal mortality by race in the U.S.
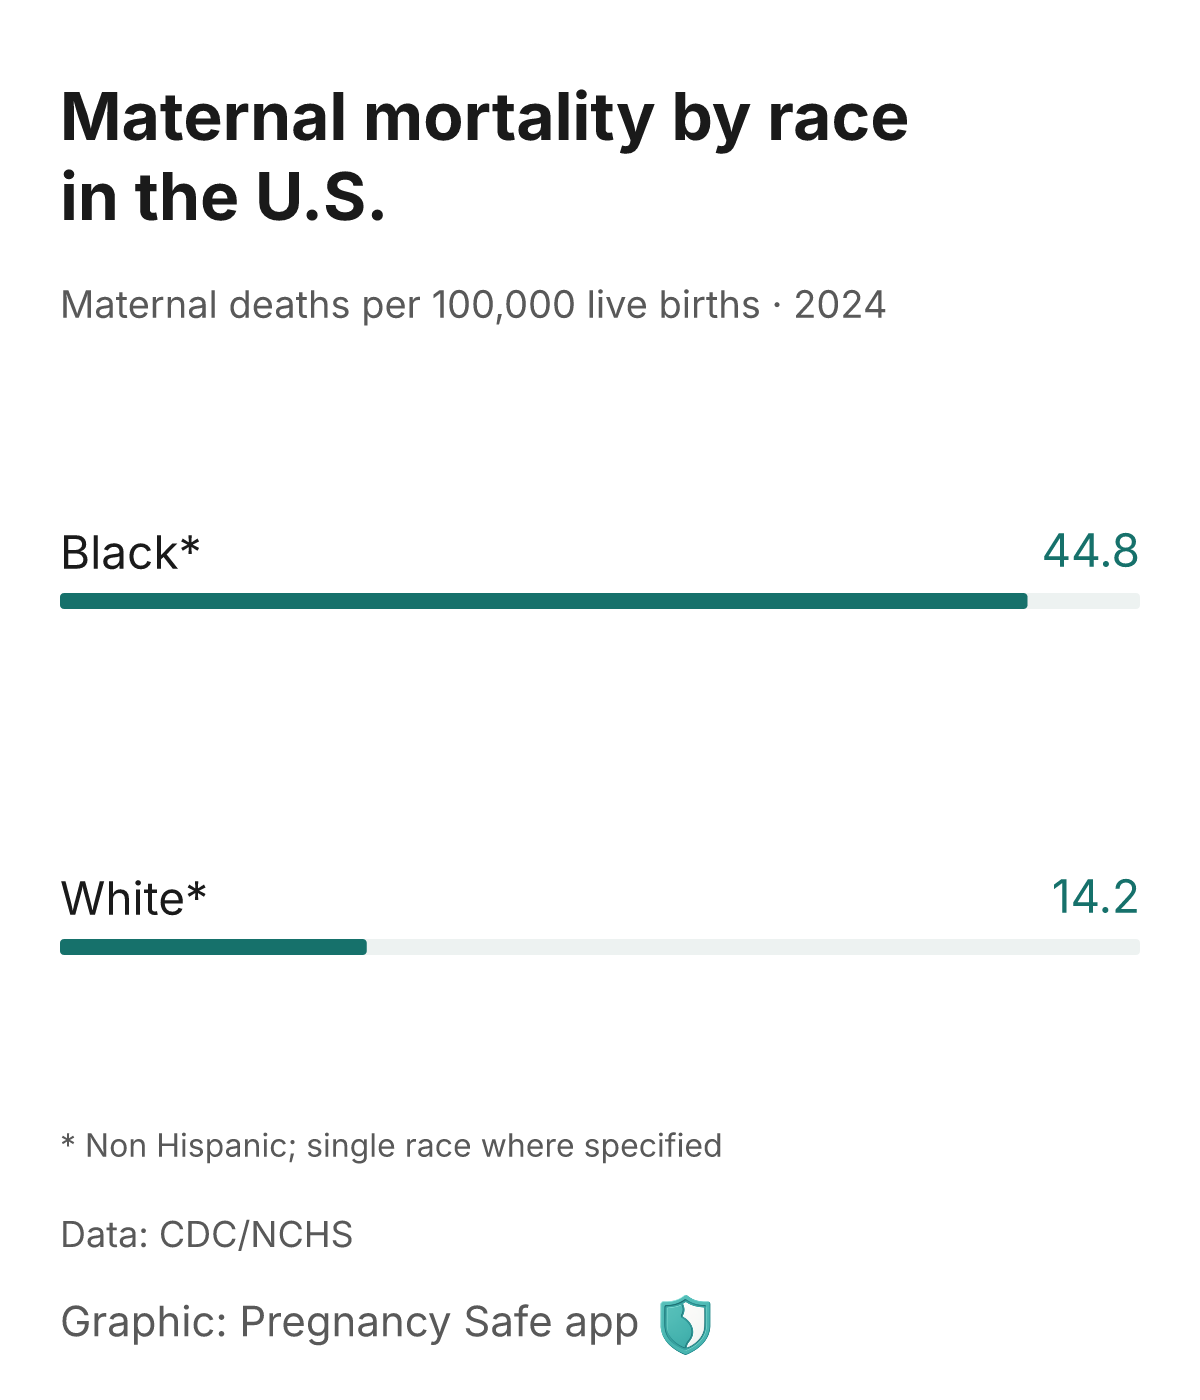
In 2024, maternal mortality rates were 44.8 per 100,000 live births for Black non Hispanic women and 14.2 for White non Hispanic women (single race groups).
Source: CDC, National Center for Health Statistics (NCHS)
Download imageDepressive symptoms late postpartum
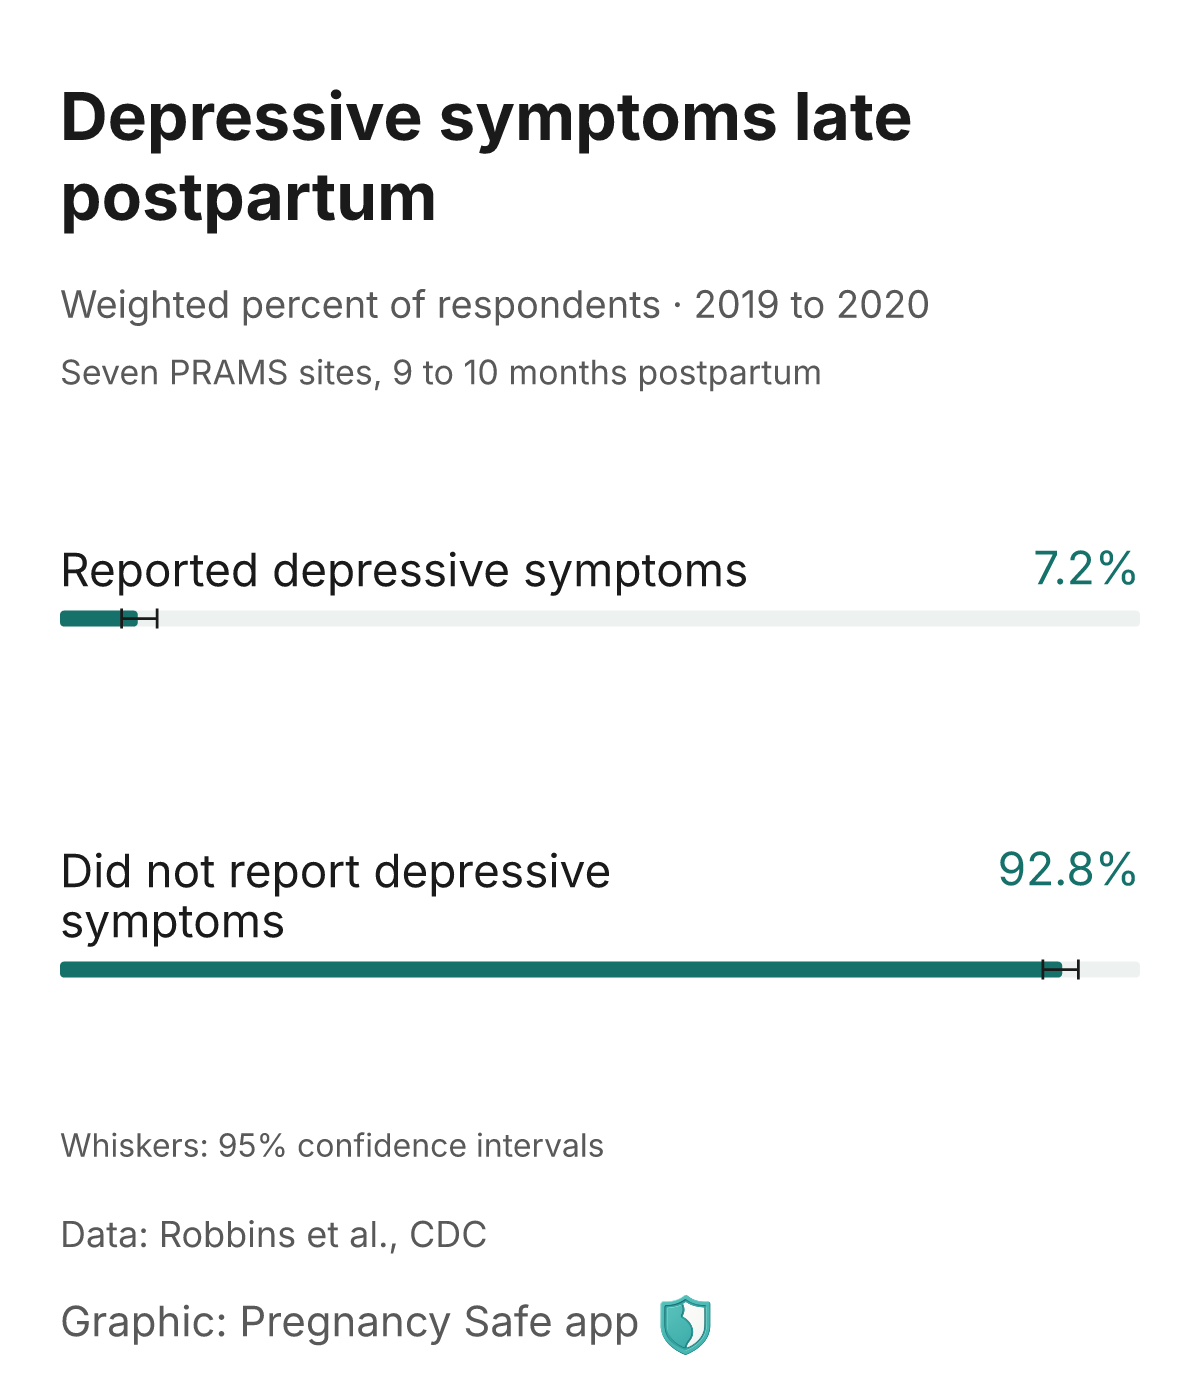
In a seven state PRAMS call back study fielded in 2019 to 2020, 7.2% reported depressive symptoms at 9 to 10 months postpartum (95% CI 5.7 to 9.0).
Source: CDC, Preventing Chronic Disease; Robbins et al.
Download imageEarlier symptoms among later postpartum cases
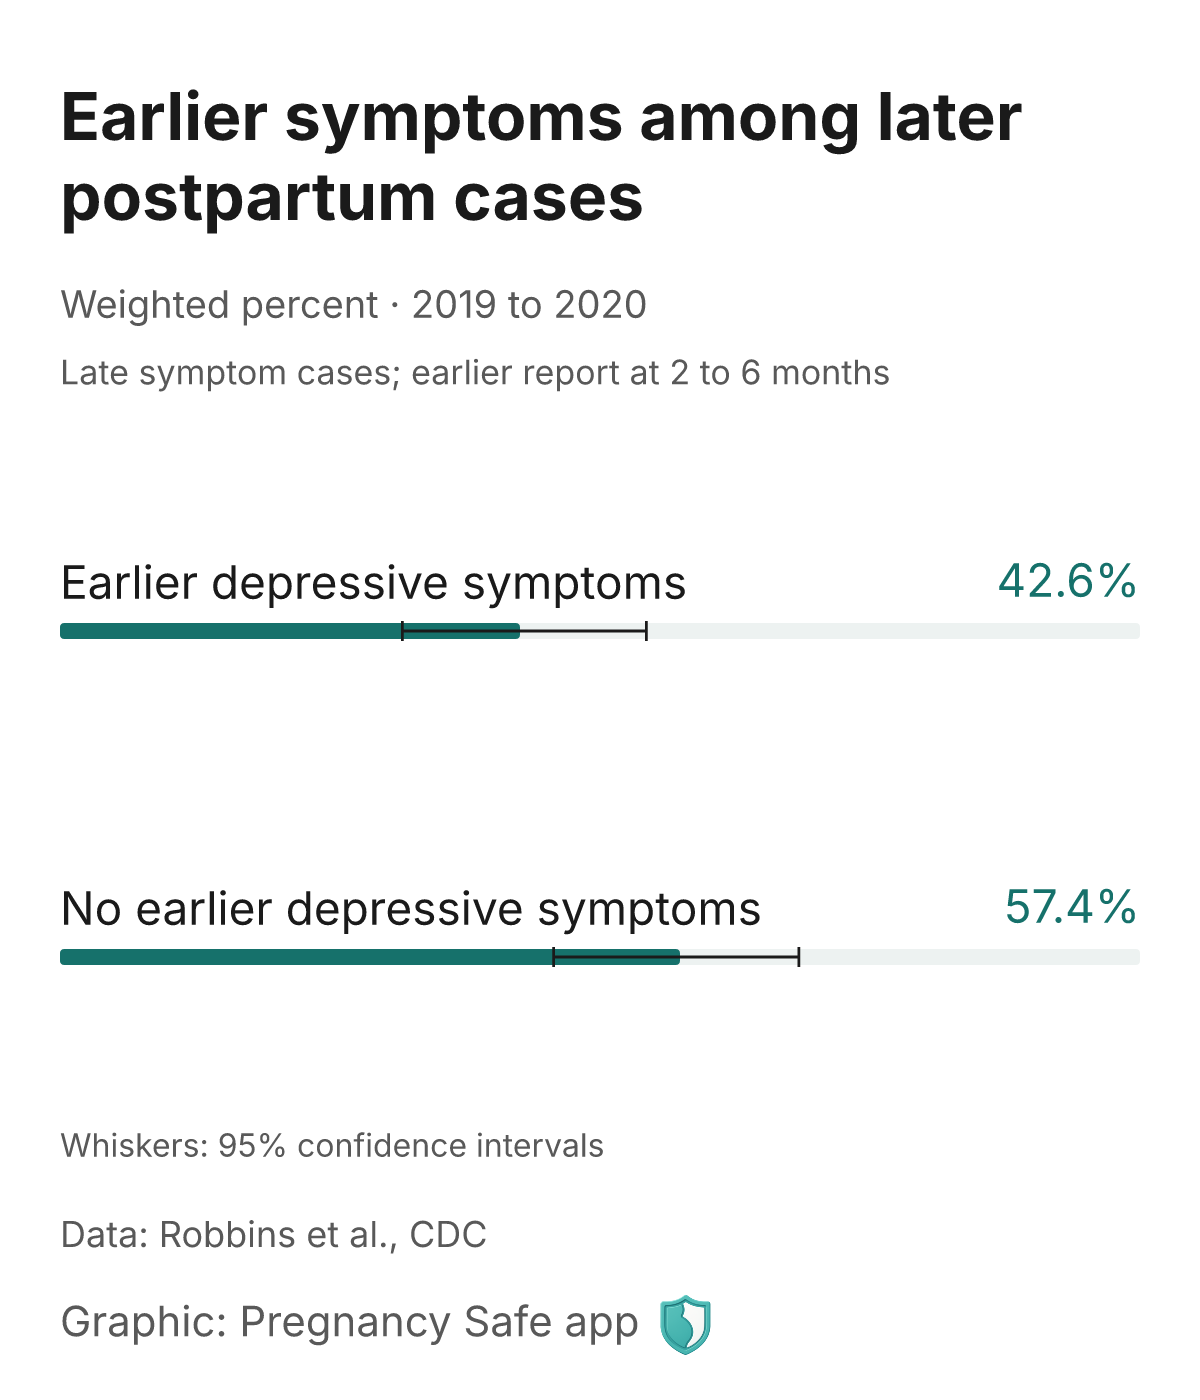
Among women reporting depressive symptoms at 9 to 10 months postpartum with paired responses in a seven state PRAMS study, 57.4% had not reported symptoms at 2 to 6 months (95% CI 45.7 to 68.4).
Source: CDC, Preventing Chronic Disease; Robbins et al.
Download imageTiming of pregnancy related deaths
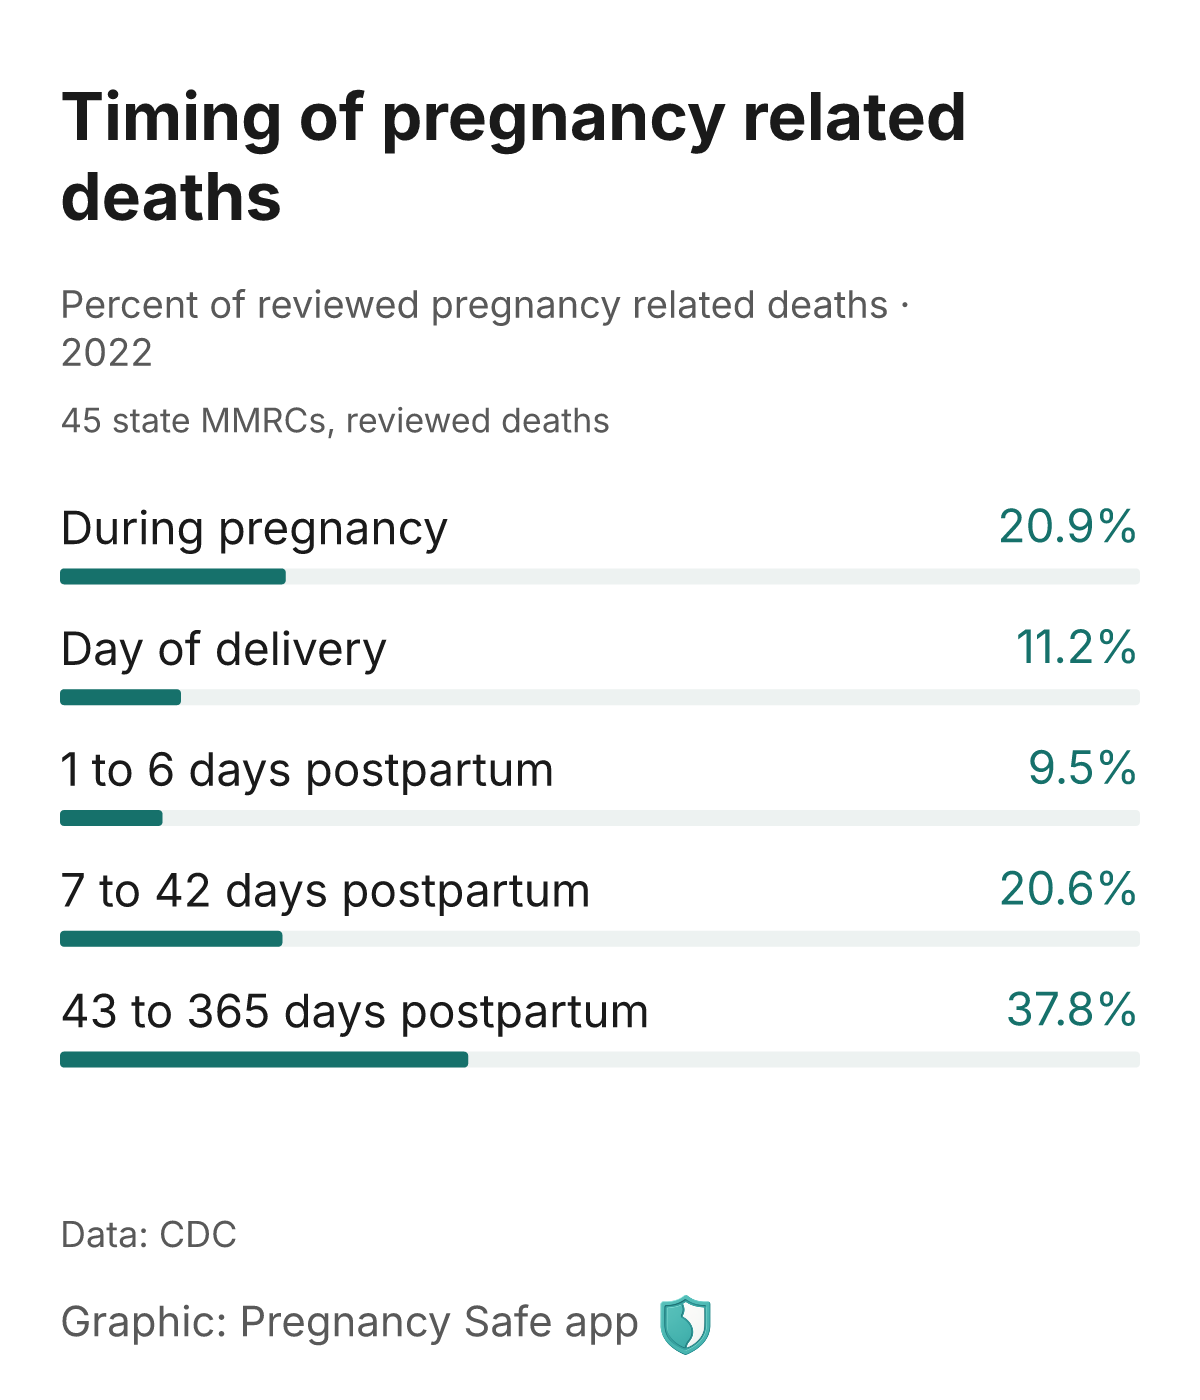
Among pregnancy related deaths reviewed by MMRCs in 45 states for 2022, 37.8% occurred 43 to 365 days after pregnancy ended.
Source: CDC
Download imageLeading causes of pregnancy related deaths
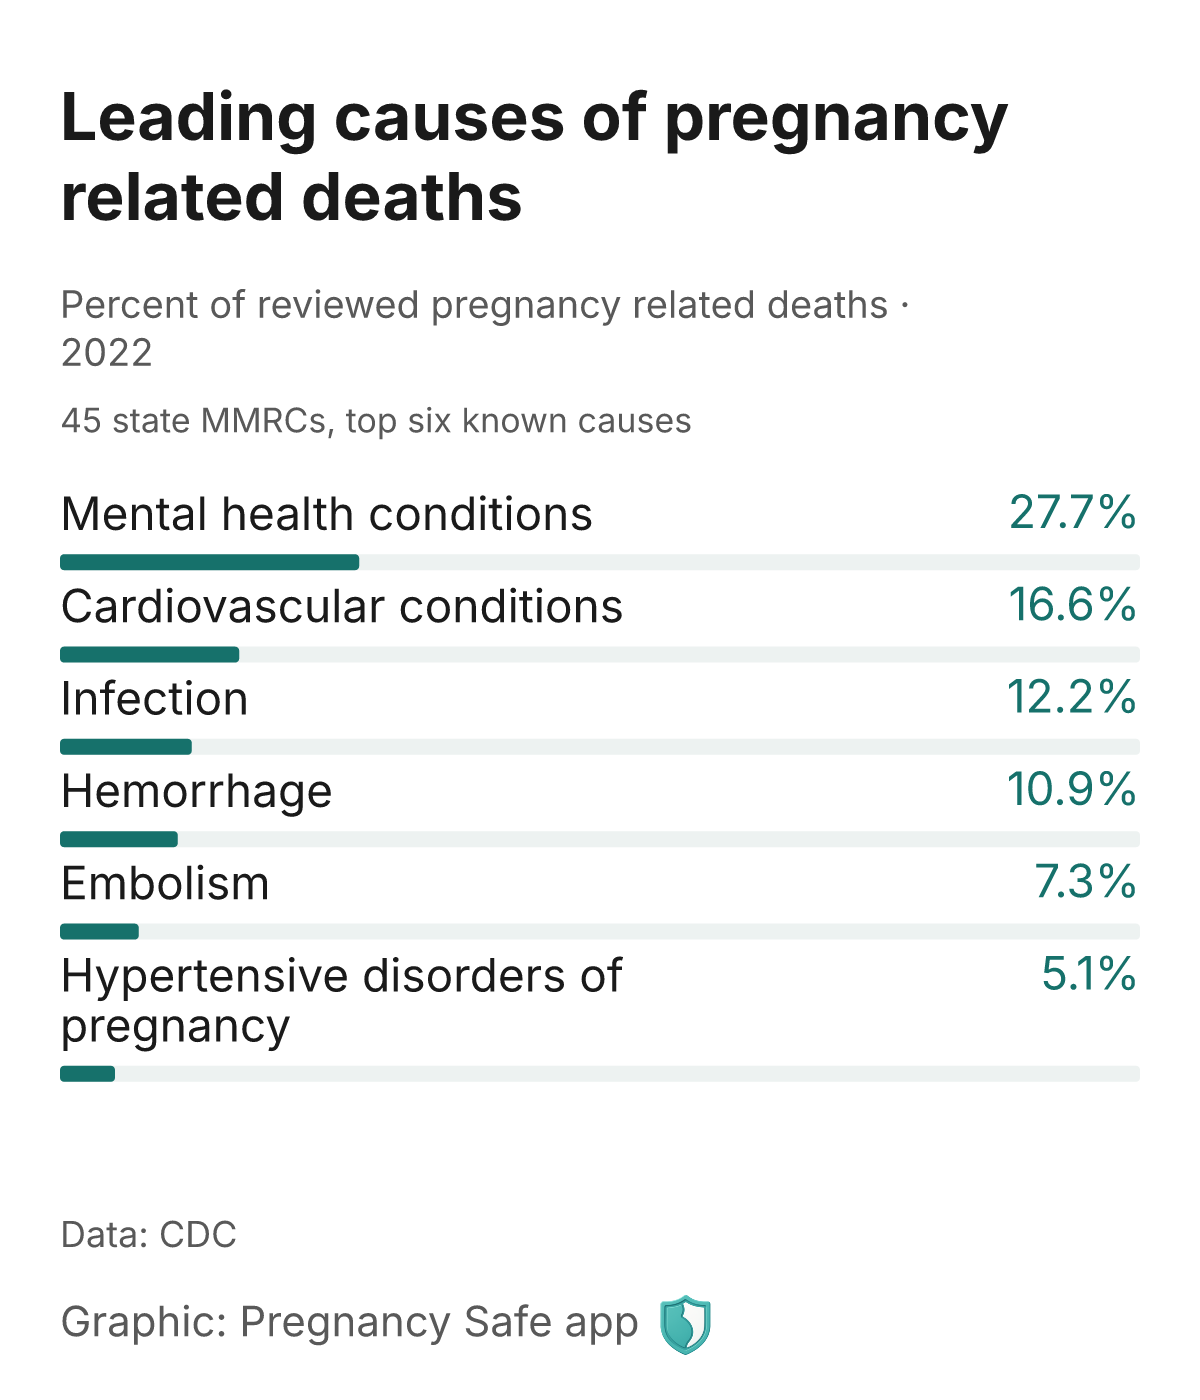
Mental health conditions were the underlying cause of 27.7% of 2022 pregnancy related deaths with a known cause reviewed by MMRCs in 45 states.
Source: CDC
Download imagePostpartum depressive symptoms by age
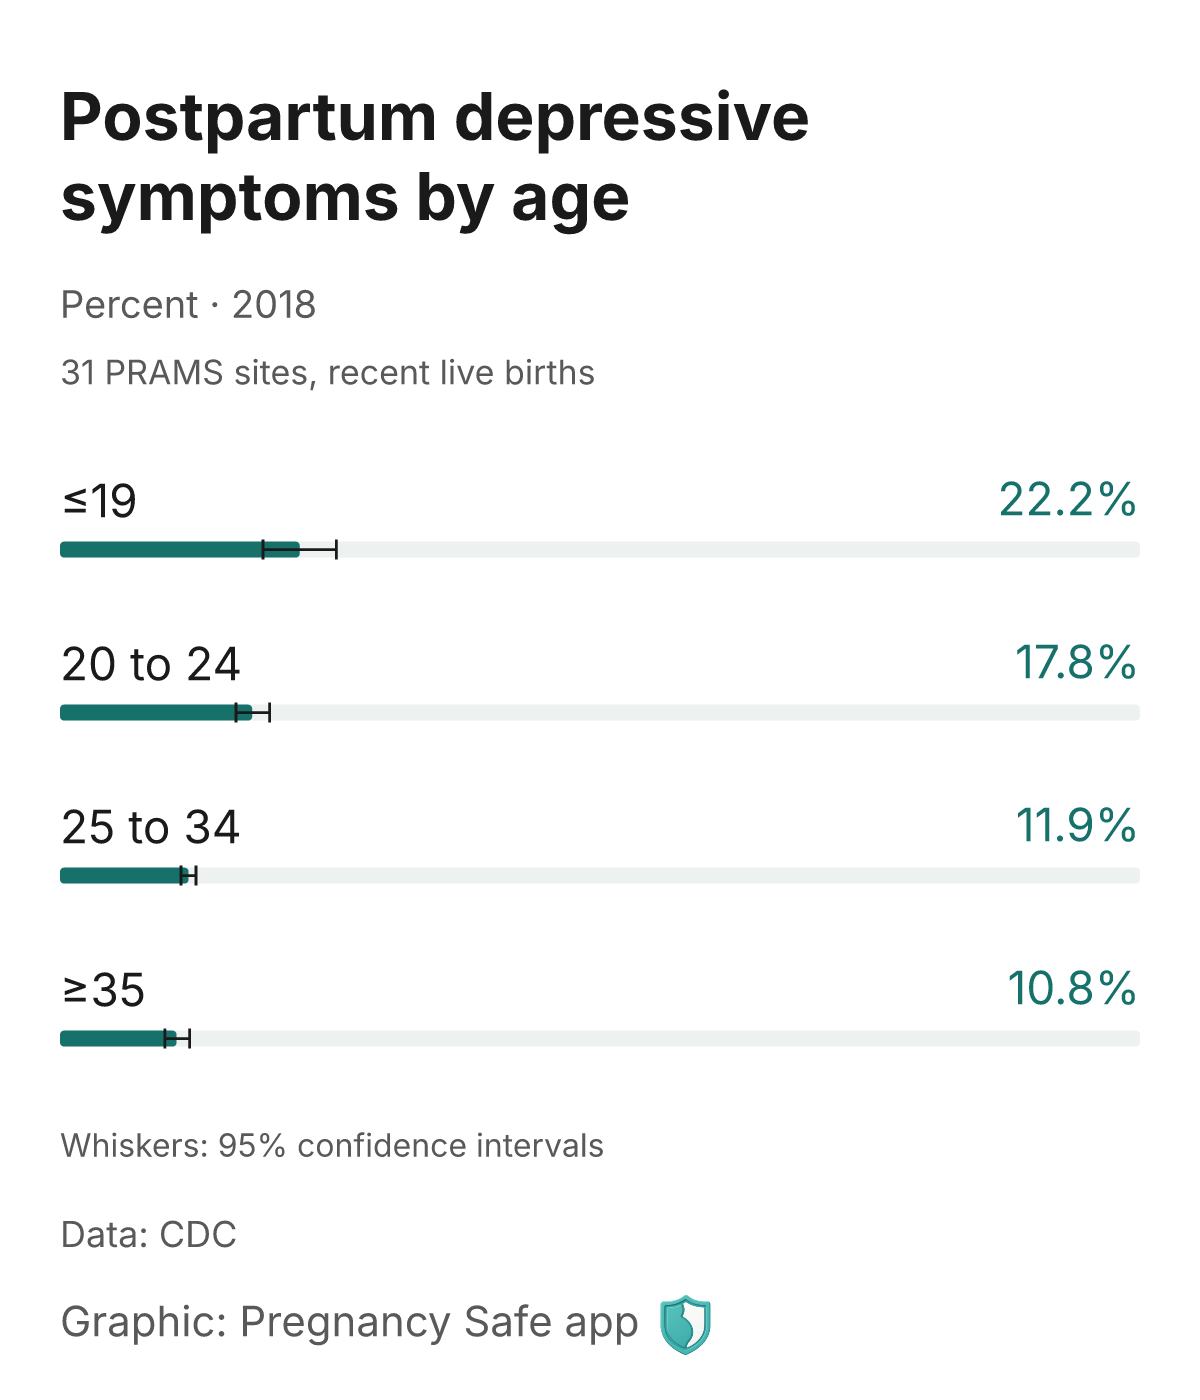
Among women with a recent live birth in 31 PRAMS sites in 2018, 13.2% reported postpartum depressive symptoms on the study’s two item symptom measure.
Source: CDC
Download imagePrenatal depression inquiry by age
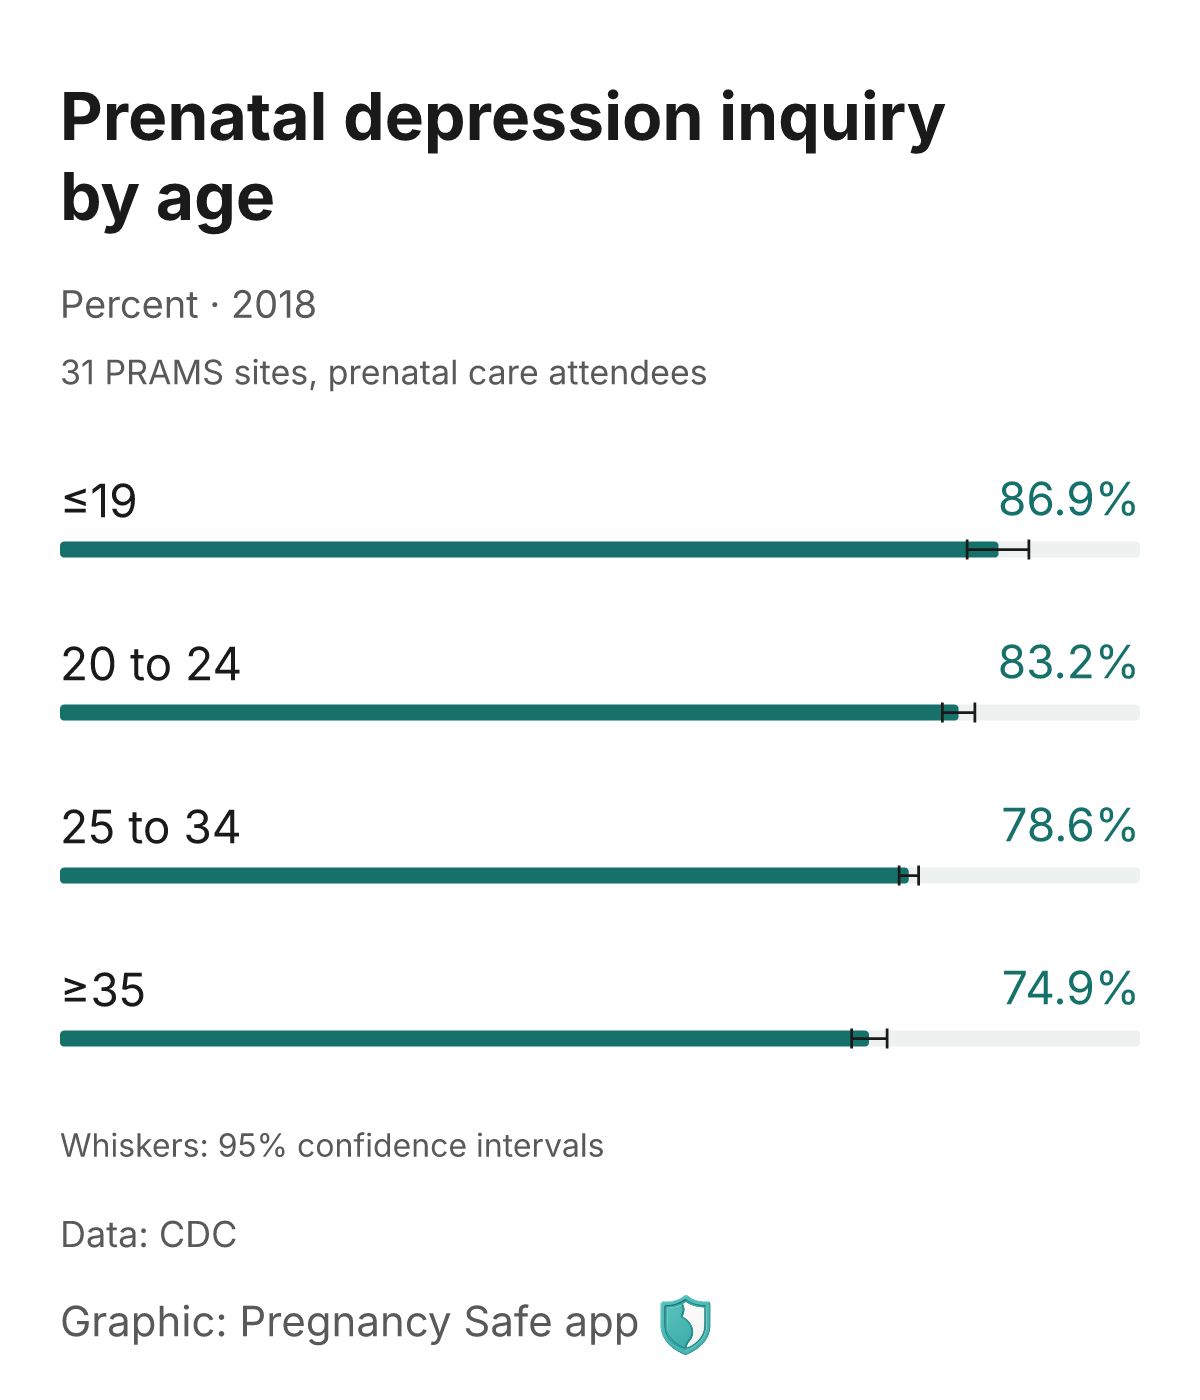
Among women with a 2018 live birth in 31 PRAMS sites who attended prenatal care, 79.1% reported that a provider asked whether they felt down or depressed at a prenatal visit.
Source: CDC
Download imagePostpartum depression inquiry by age
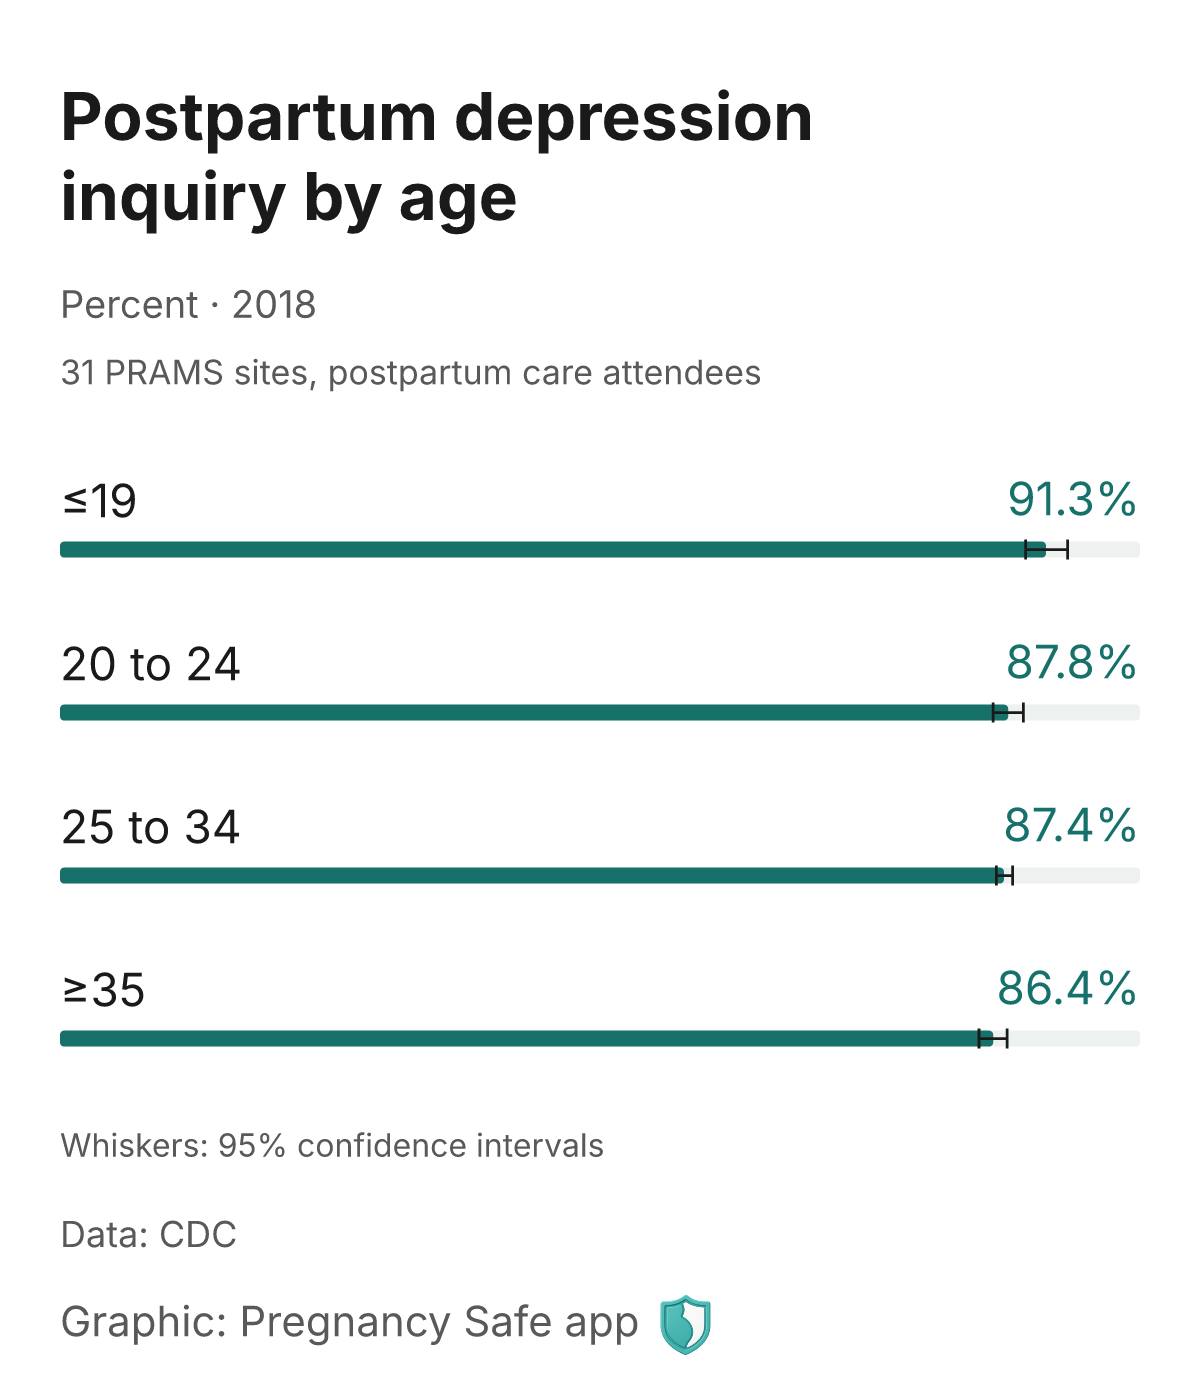
Among women with a 2018 live birth in 31 PRAMS sites who attended postpartum care, 87.4% reported that a provider asked whether they felt down or depressed at a postpartum visit.
Source: CDC
Download imageU.S. maternal mortality by age
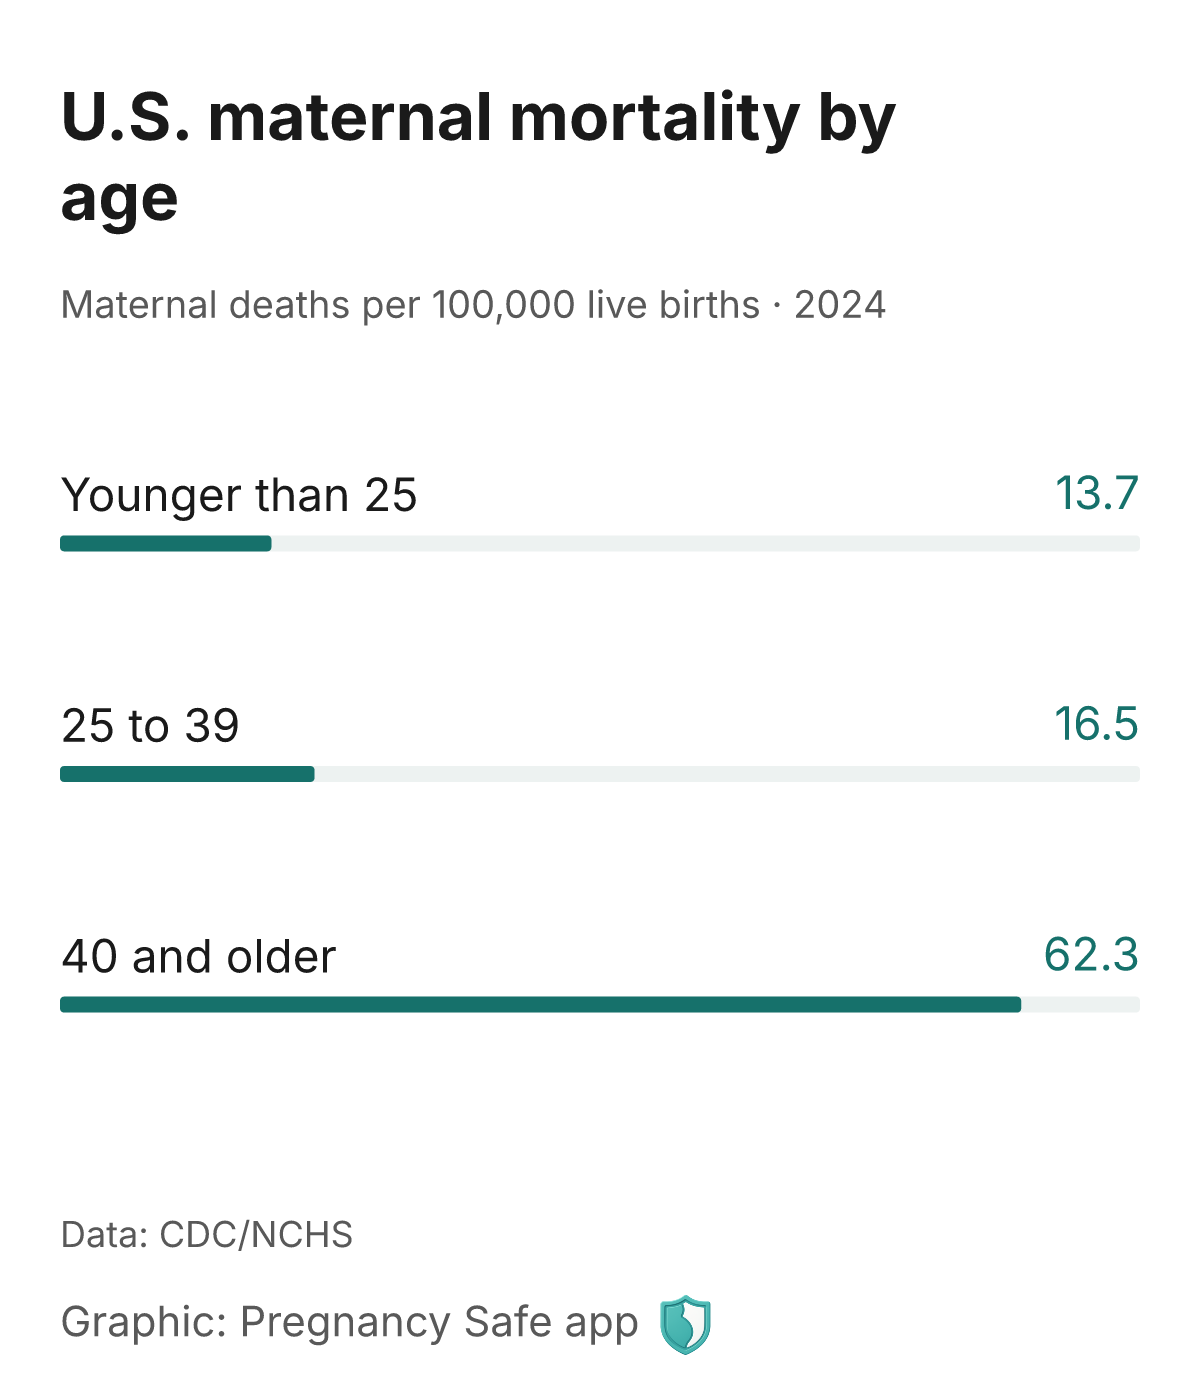
In 2024, the U.S. maternal mortality rate was 62.3 per 100,000 live births for women ages 40 and older, compared with 13.7 under age 25 and 16.5 at ages 25 to 39.
Source: CDC, National Center for Health Statistics (NCHS)
Download imageMost checked foods and products
Most checked foods in Pregnancy Safe
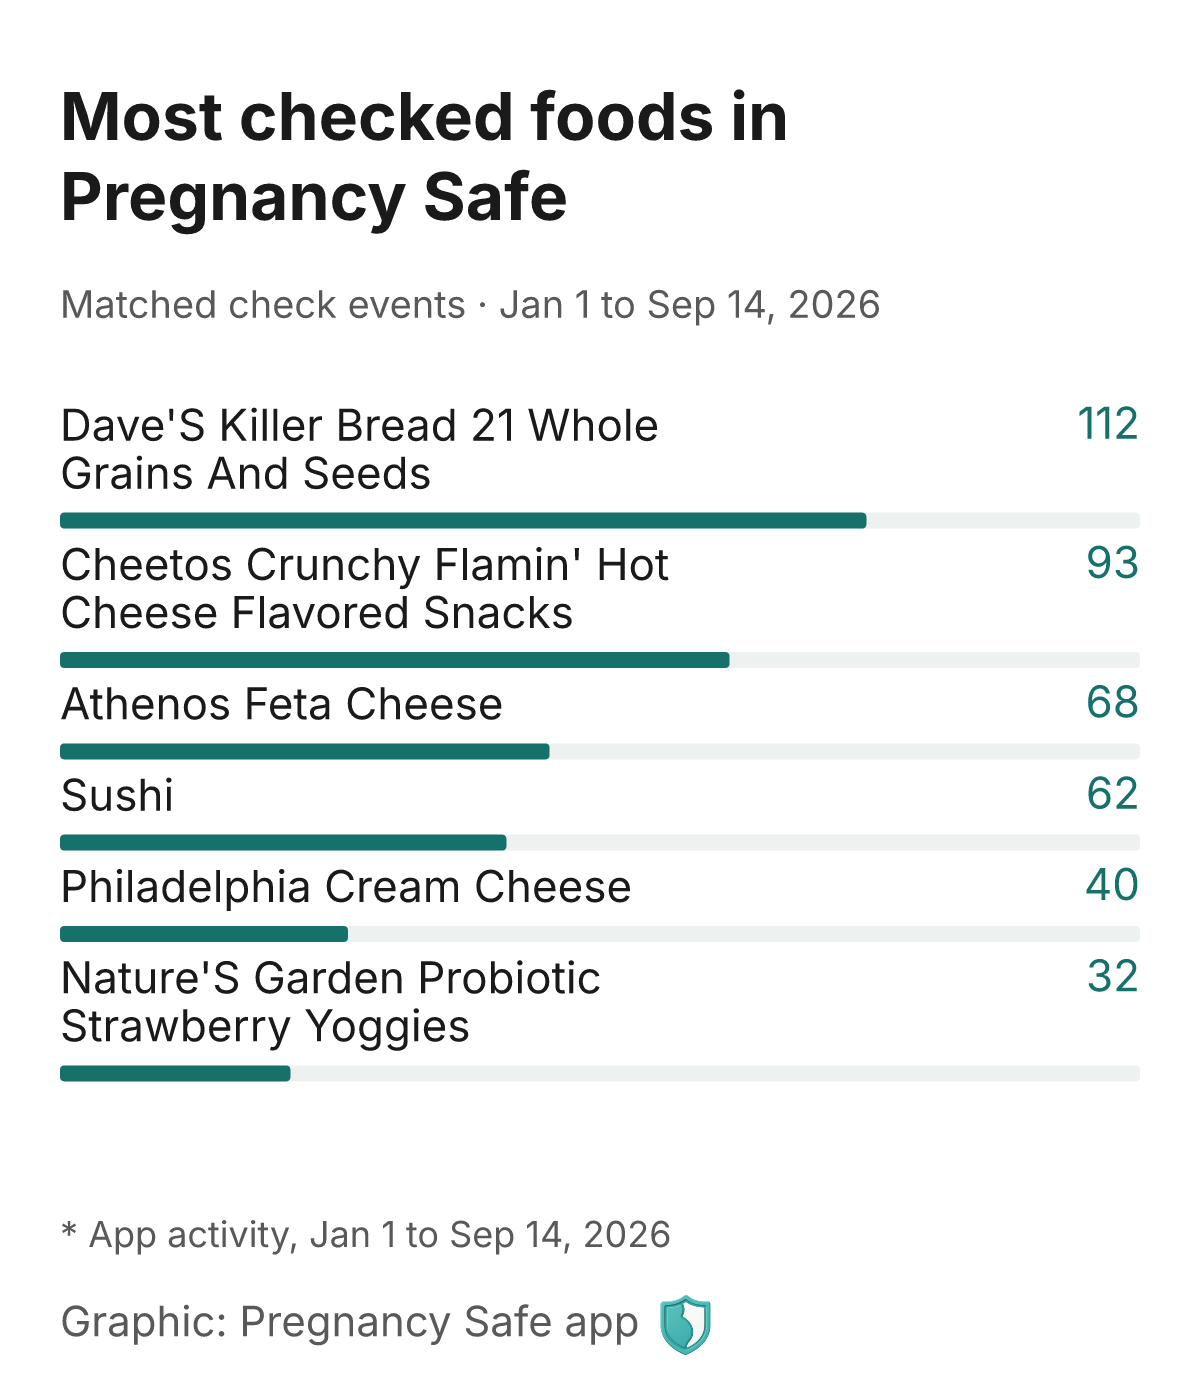
Among checks exactly matched to the Pregnancy Safe catalog, Dave'S Killer Bread 21 Whole Grains And Seeds had 112 product checks in the food scope from January 1, 2026 to September 14, 2026. Checks are events, not individual people or purchases.
Download imageMost checked drinks in Pregnancy Safe
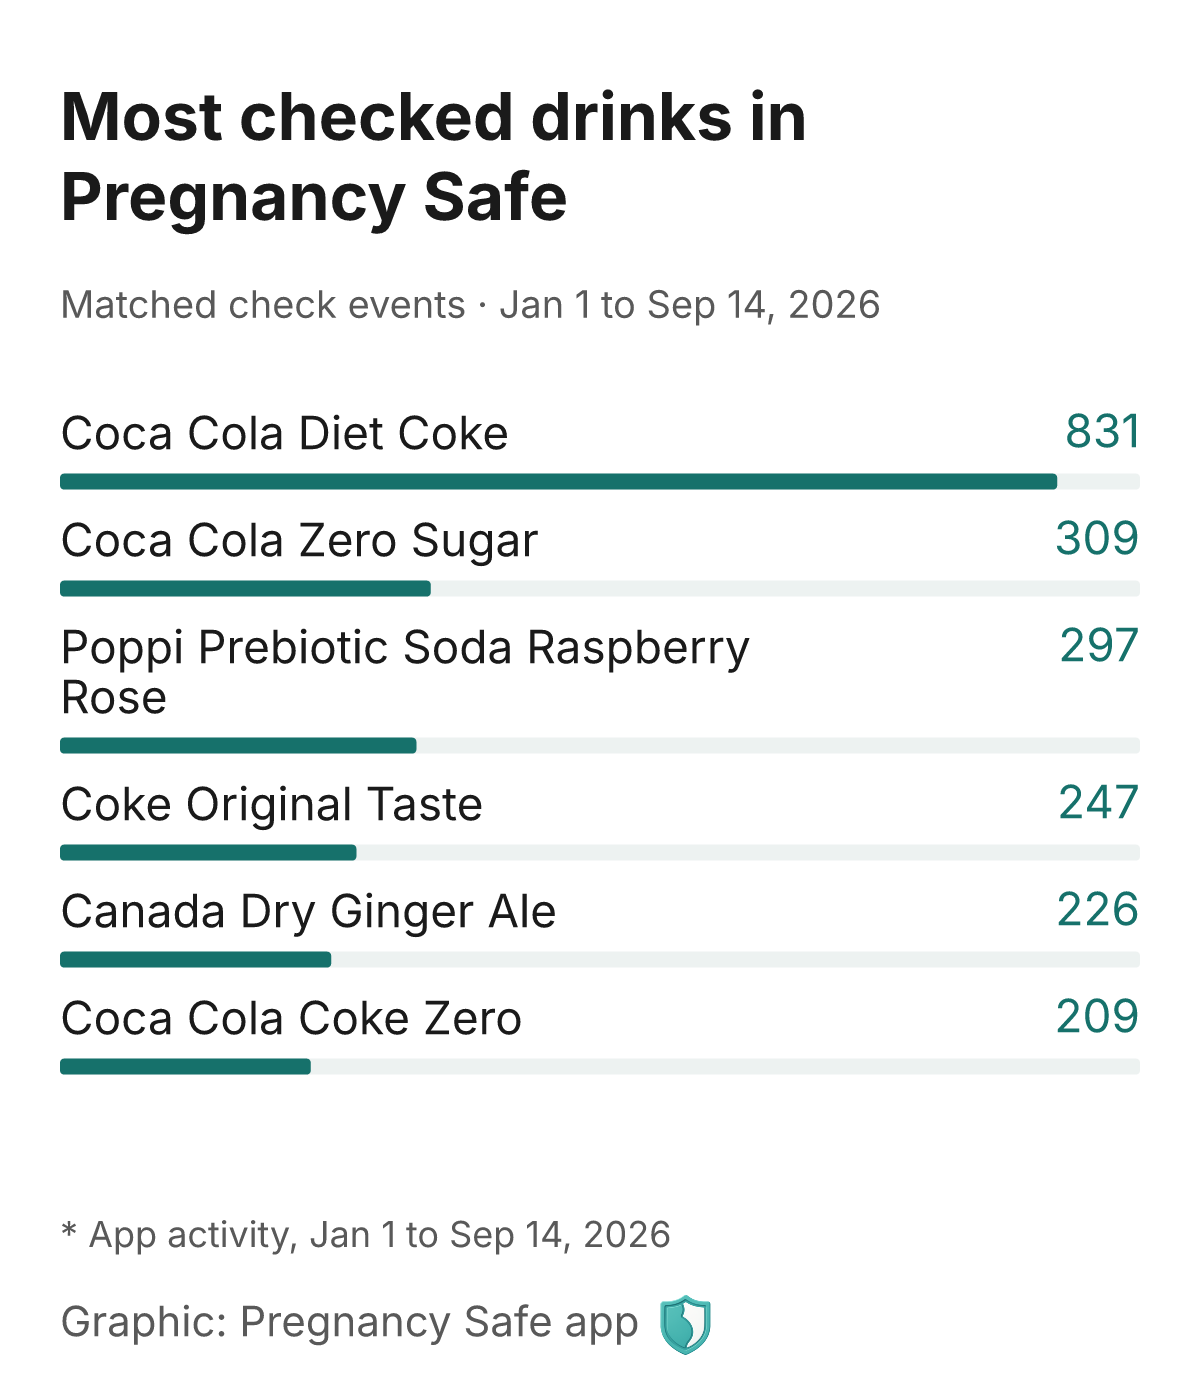
Among checks exactly matched to the Pregnancy Safe catalog, Coca Cola Diet Coke had 831 product checks in the drinks scope from January 1, 2026 to September 14, 2026. Checks are events, not individual people or purchases.
Download imageMost checked skincare products in Pregnancy Safe
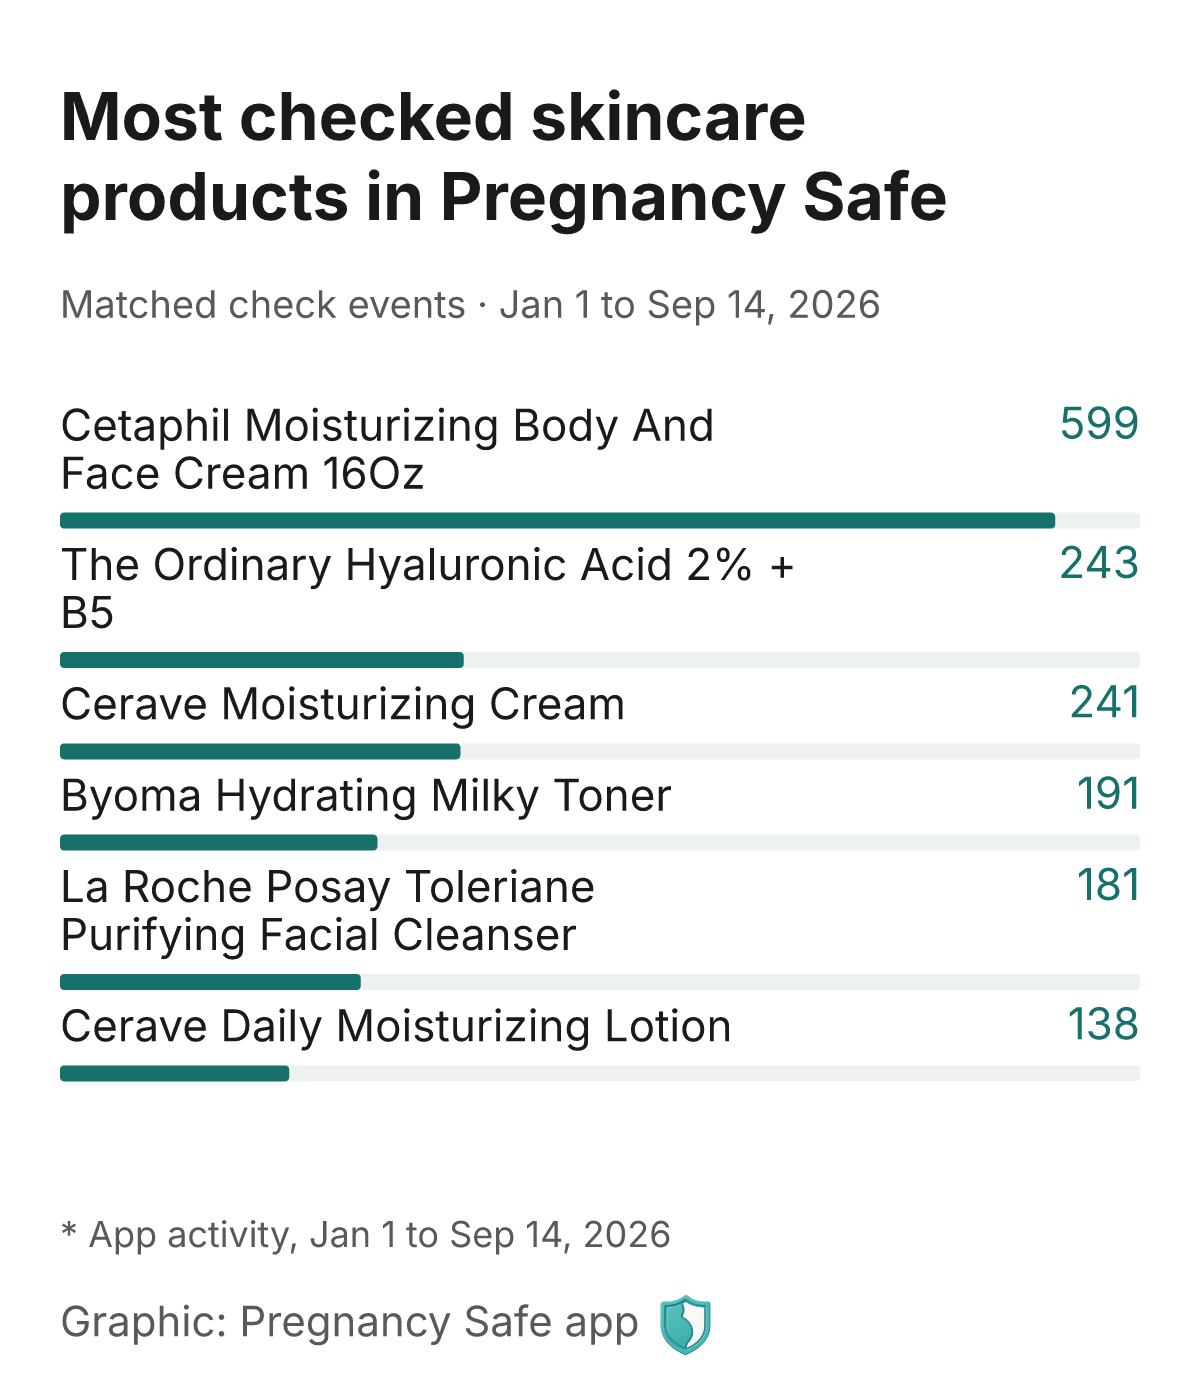
Among checks exactly matched to the Pregnancy Safe catalog, Cetaphil Moisturizing Body And Face Cream 16Oz had 599 product checks in the skincare scope from January 1, 2026 to September 14, 2026. Checks are events, not individual people or purchases.
Download imageMost checked haircare products in Pregnancy Safe
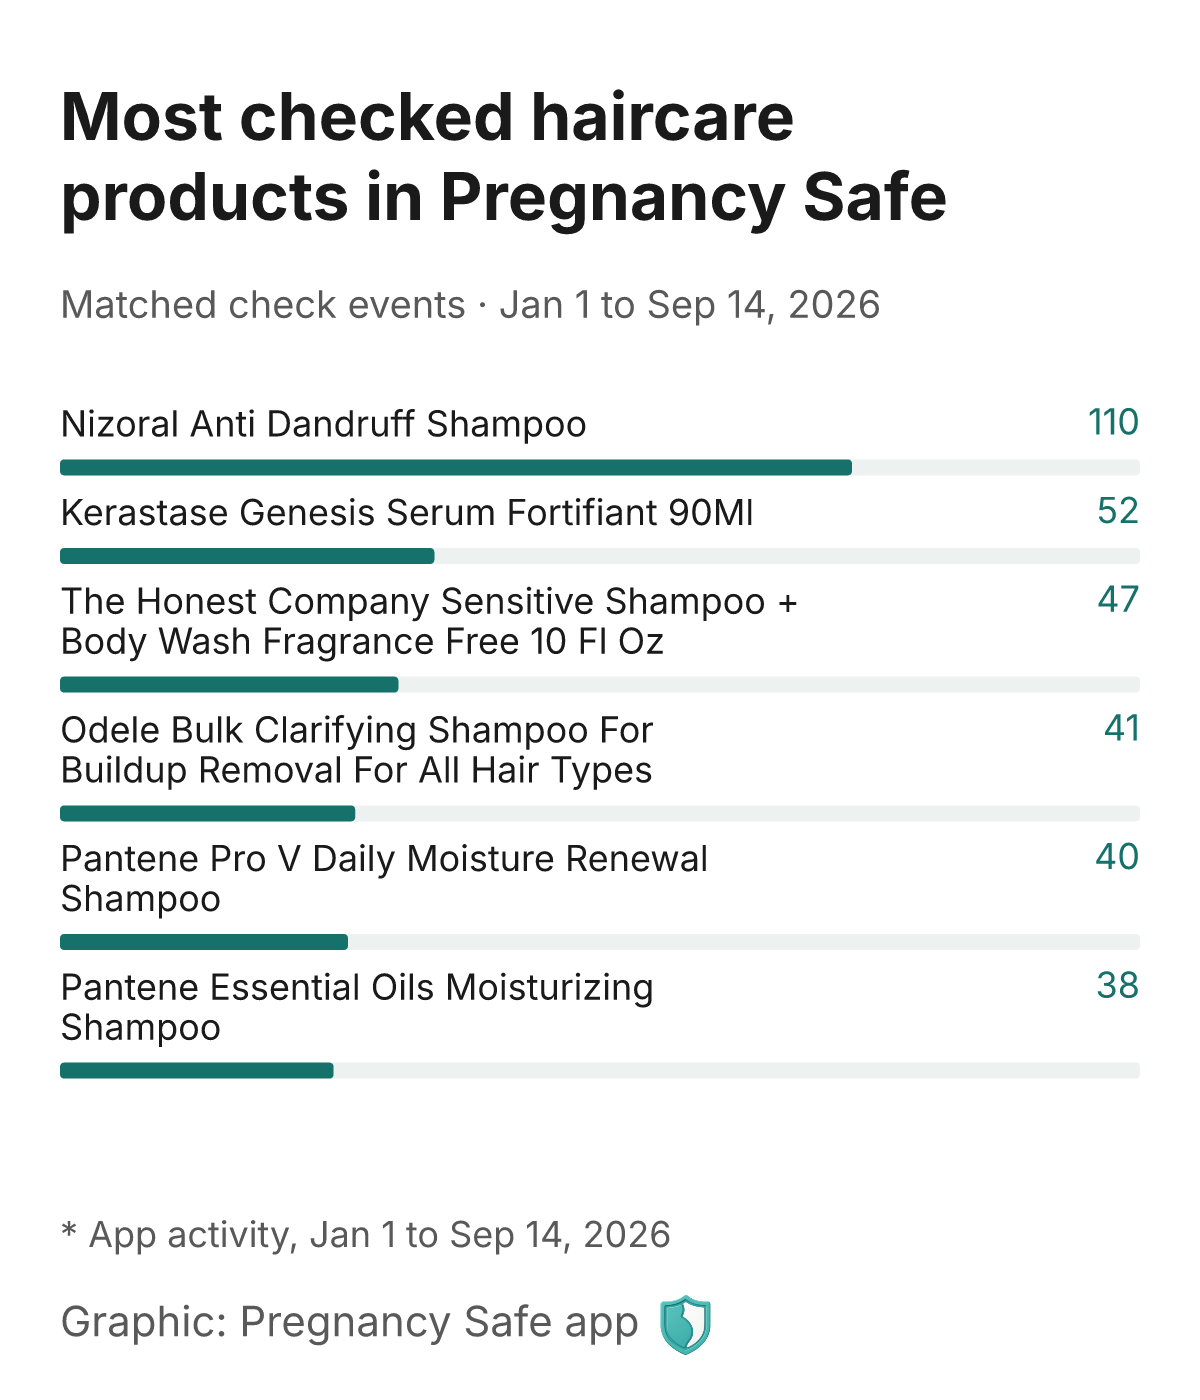
Among checks exactly matched to the Pregnancy Safe catalog, Nizoral Anti Dandruff Shampoo had 110 product checks in the haircare scope from January 1, 2026 to September 14, 2026. Checks are events, not individual people or purchases.
Download imageMost checked makeup products in Pregnancy Safe
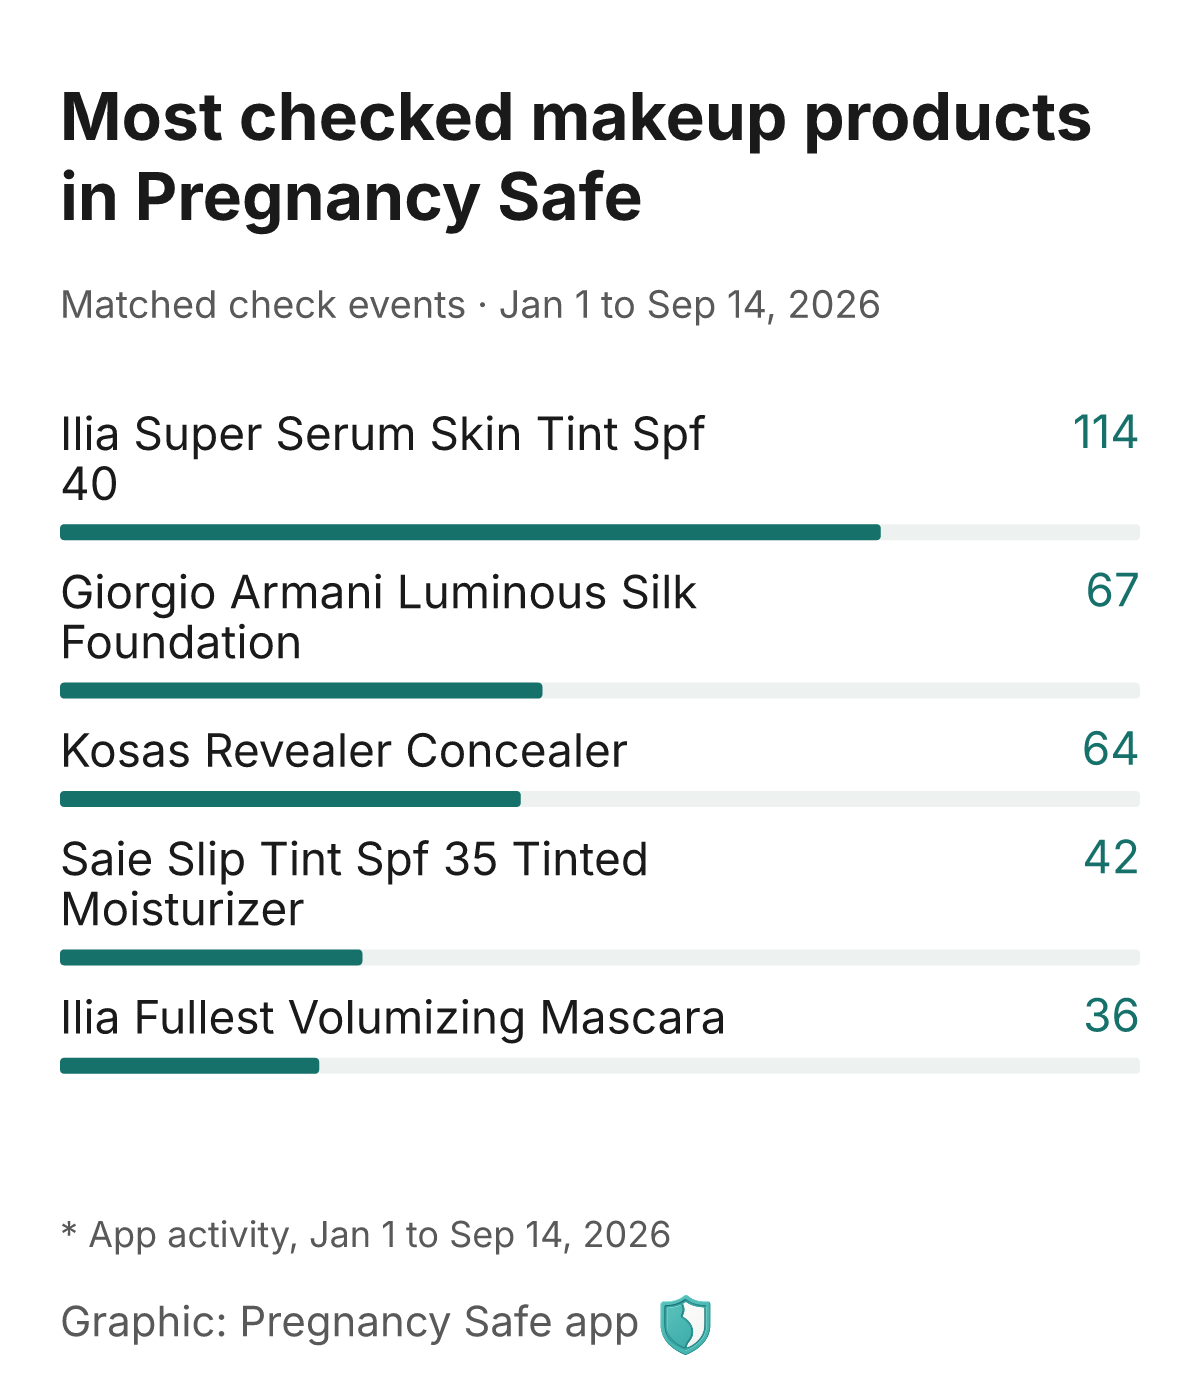
Among checks exactly matched to the Pregnancy Safe catalog, Ilia Super Serum Skin Tint Spf 40 had 114 product checks in the makeup scope from January 1, 2026 to September 14, 2026. Checks are events, not individual people or purchases.
Download imageMost checked body care products in Pregnancy Safe
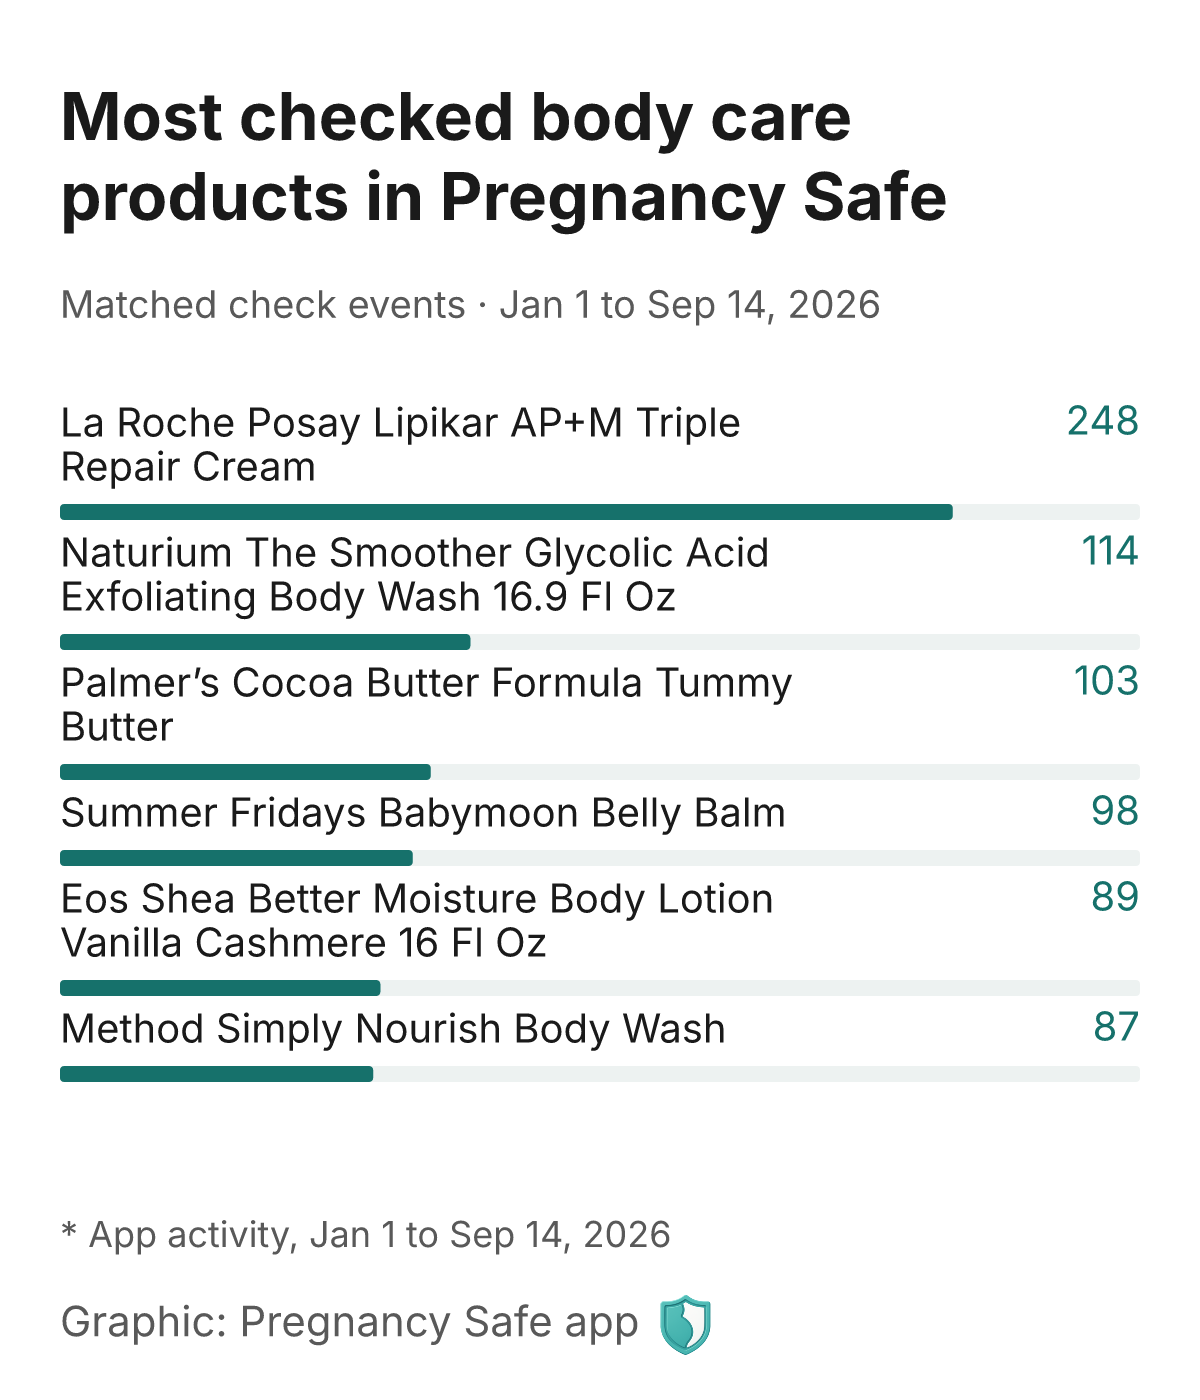
Among checks exactly matched to the Pregnancy Safe catalog, La Roche Posay Lipikar Ap+M Triple Repair Body Moisturizing Cream Body And Face Moisturizer For Dry Skin With Shea Butter And Glycerin had 248 product checks in the bodycare scope from January 1, 2026 to September 14, 2026. Checks are events, not individual people or purchases.
Download imageMost checked sunscreens in Pregnancy Safe
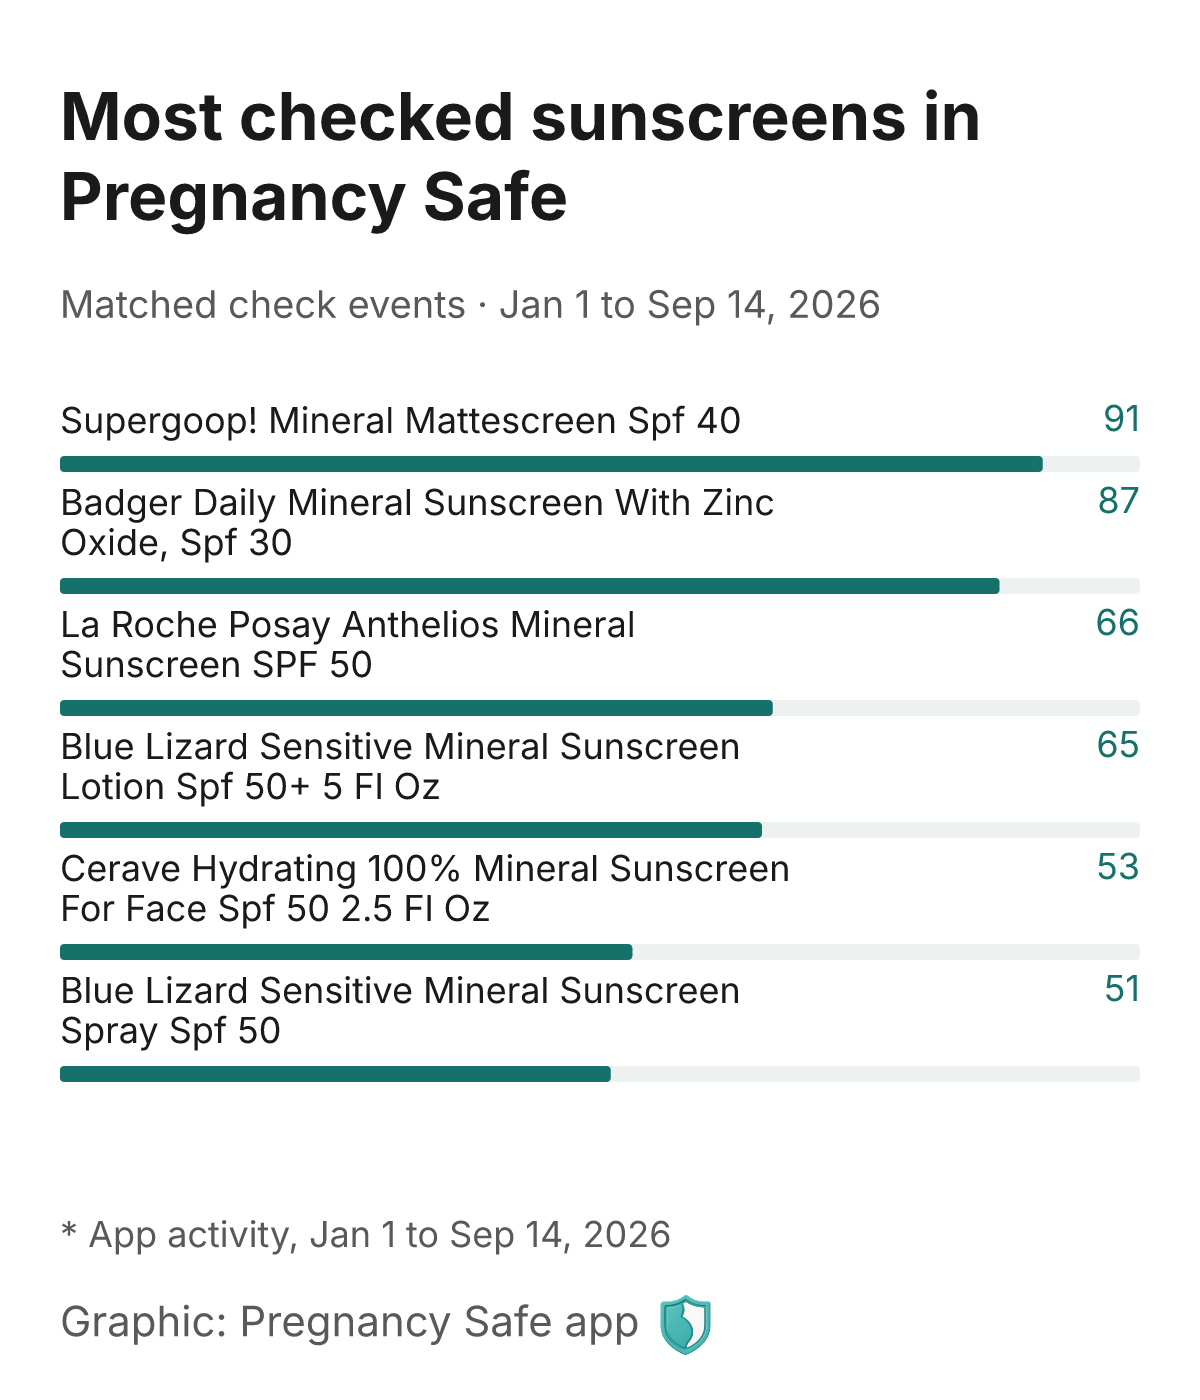
Among checks exactly matched to the Pregnancy Safe catalog, Supergoop! Mineral Mattescreen Spf 40 had 91 product checks in the sunscreen scope from January 1, 2026 to September 14, 2026. Checks are events, not individual people or purchases.
Download imageMost checked supplements in Pregnancy Safe
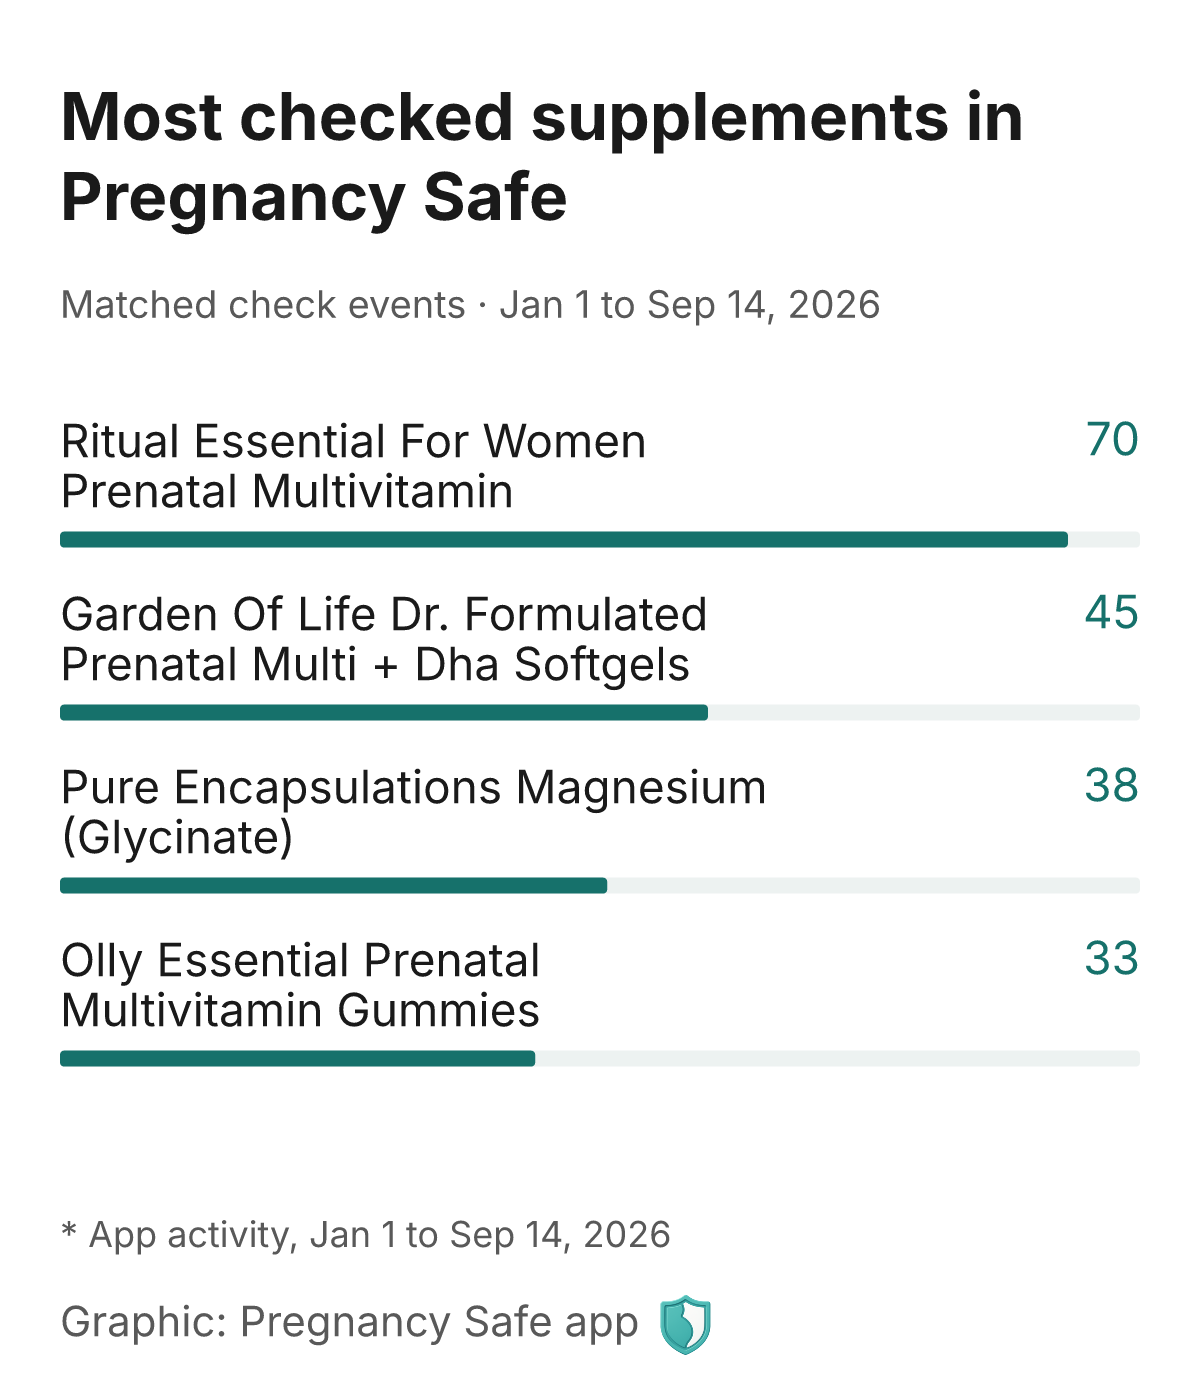
Among checks exactly matched to the Pregnancy Safe catalog, Ritual Essential For Women Prenatal Multivitamin had 70 product checks in the supplement scope from January 1, 2026 to September 14, 2026. Checks are events, not individual people or purchases.
Download imageMost checked sports and electrolyte drinks in Pregnancy Safe
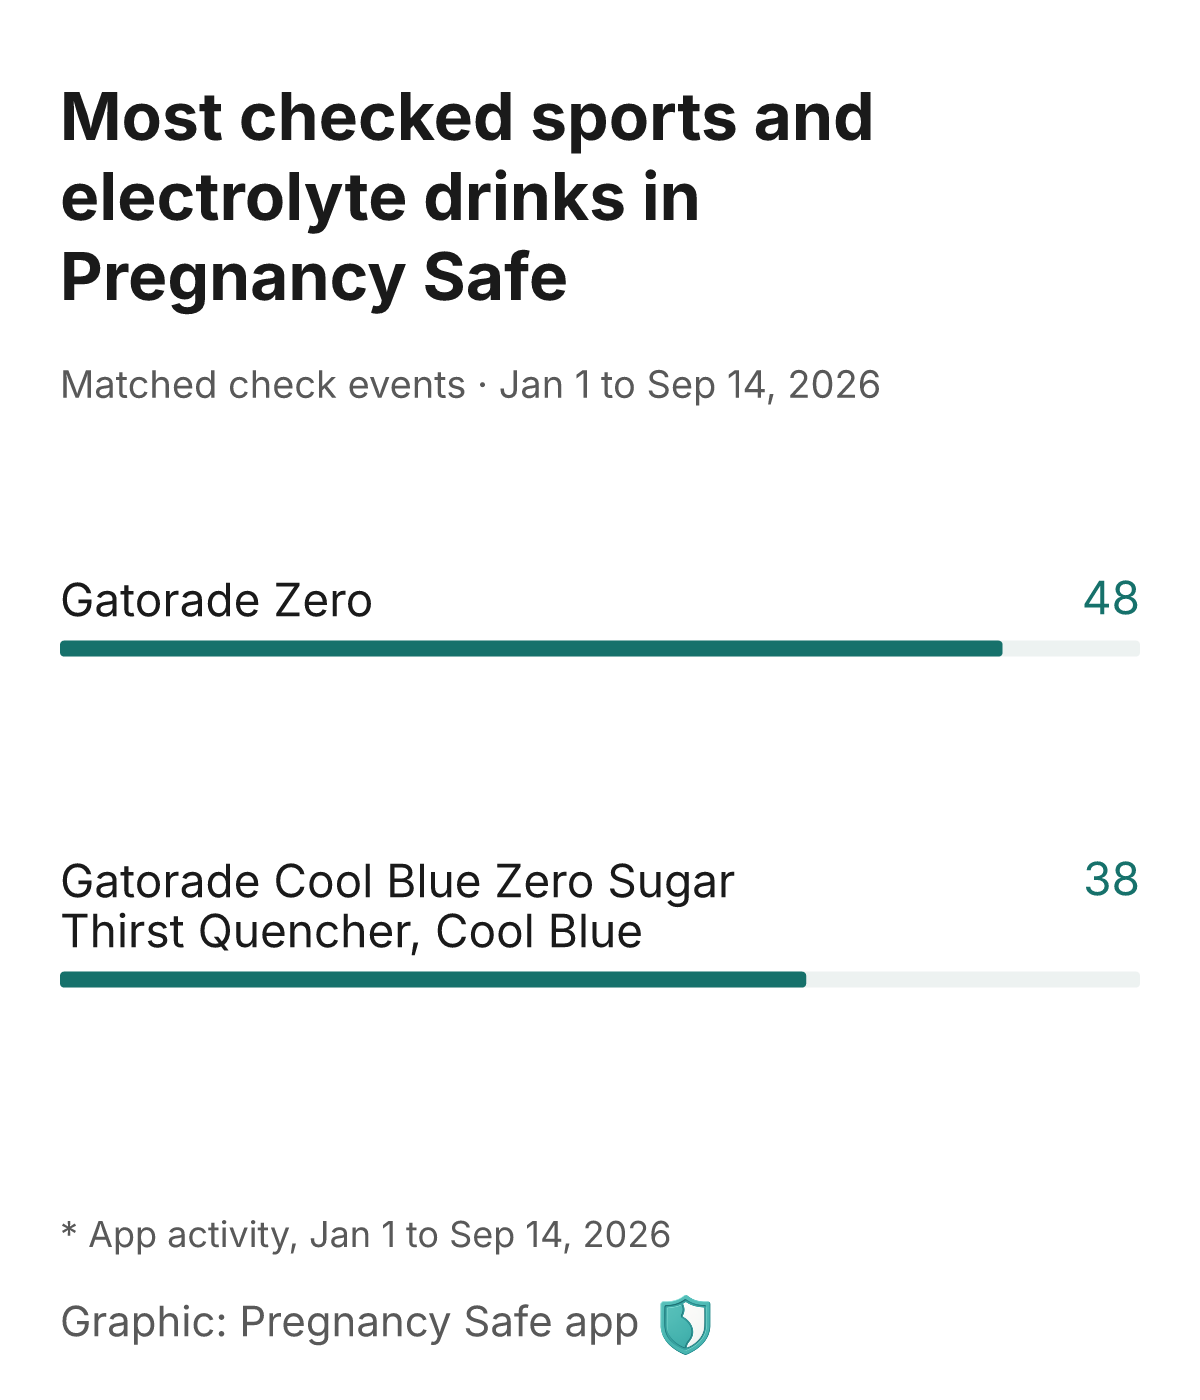
Among checks exactly matched to the Pregnancy Safe catalog, Gatorade Zero had 48 product checks in the sports electrolyte drink scope from January 1, 2026 to September 14, 2026. Checks are events, not individual people or purchases.
Download imageMost checked medicines in Pregnancy Safe
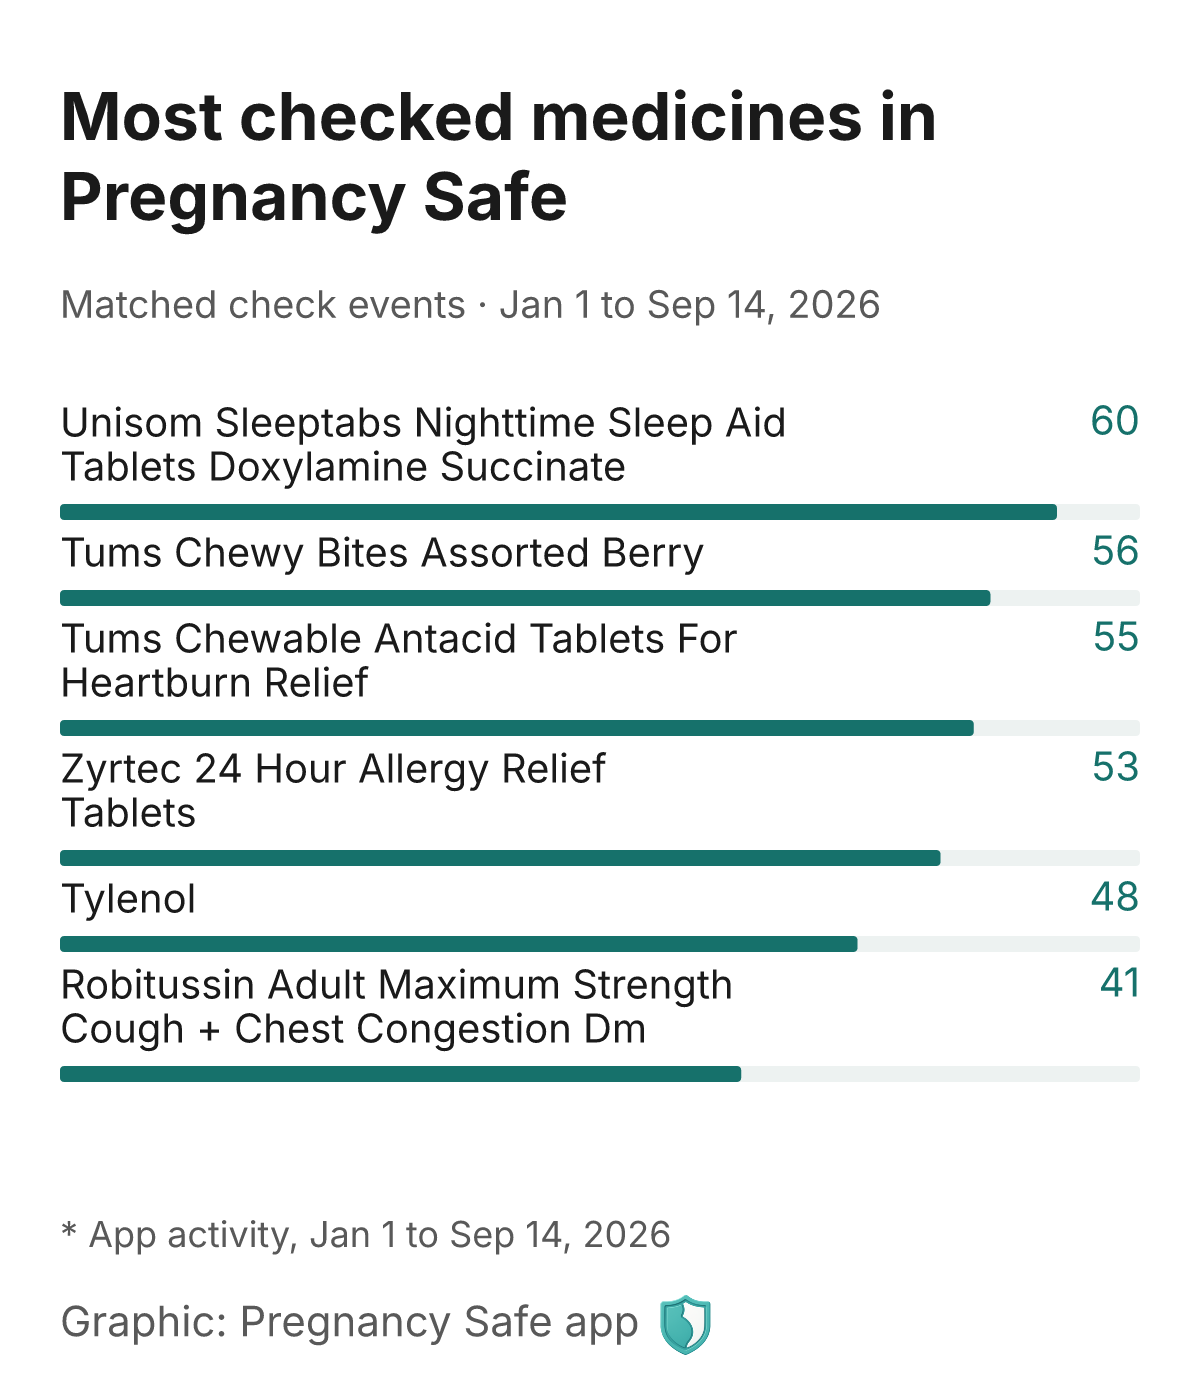
Among checks exactly matched to the Pregnancy Safe catalog, Unisom Sleeptabs Nighttime Sleep Aid Tablets Doxylamine Succinate had 60 product checks in the medicine scope from January 1, 2026 to September 14, 2026. Checks are events, not individual people or purchases.
Download imageMost checked sodas in Pregnancy Safe
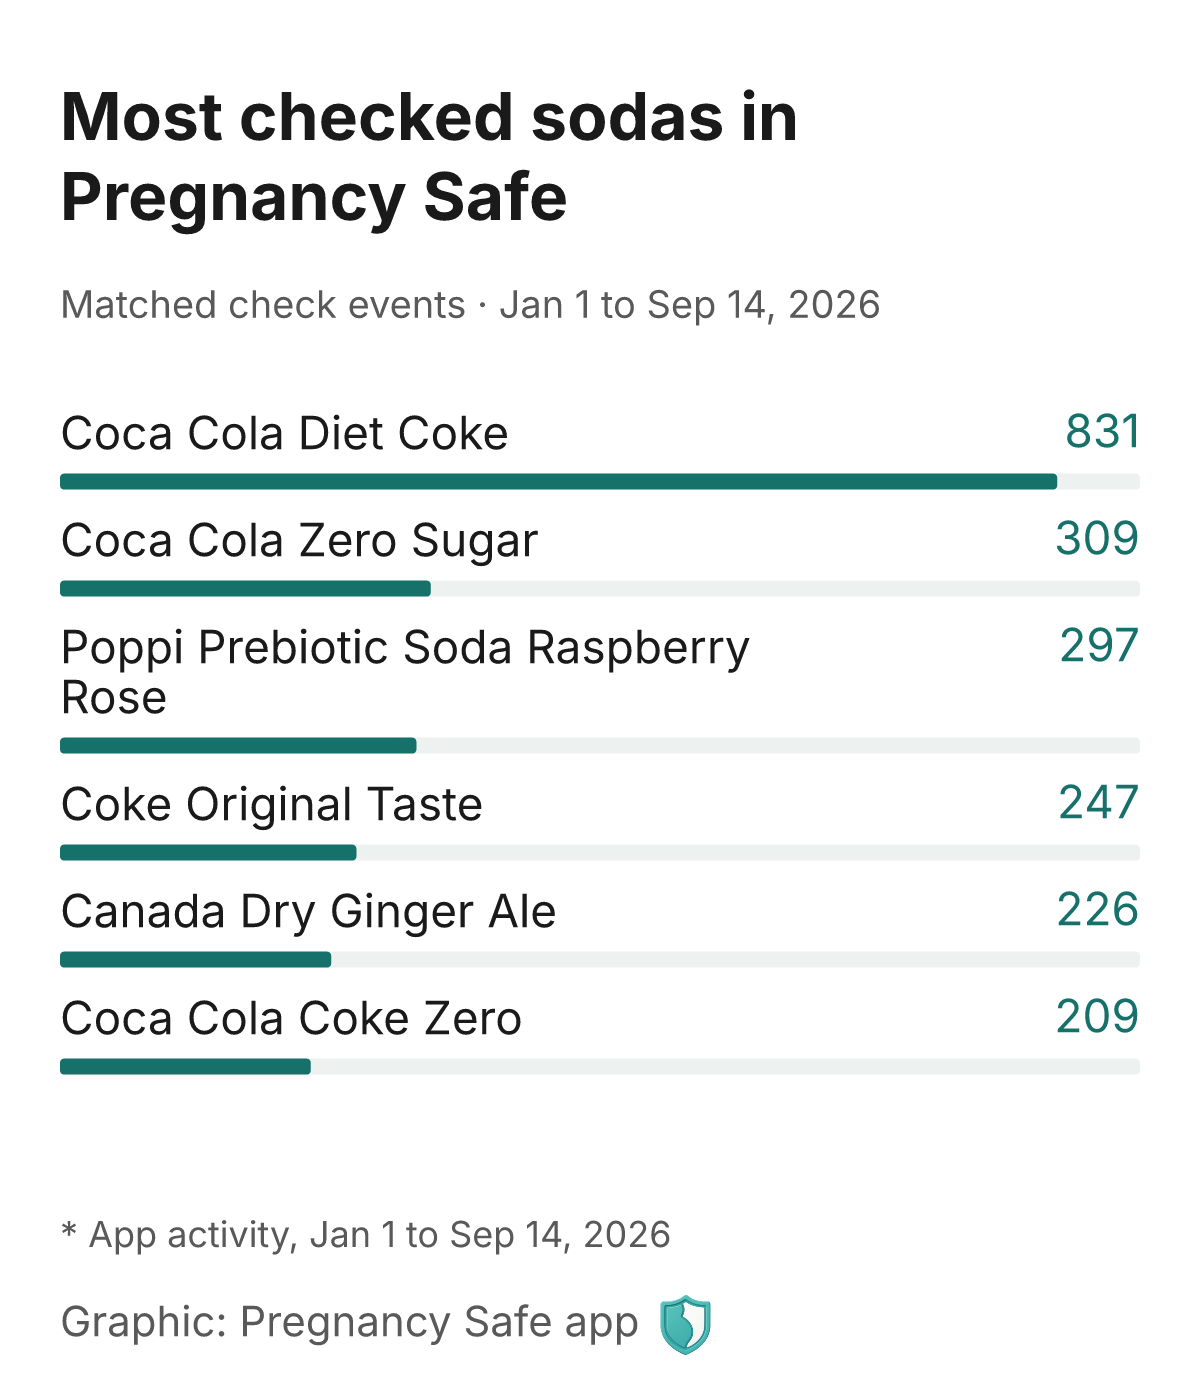
Among checks exactly matched to the Pregnancy Safe catalog, Coca Cola Diet Coke had 831 product checks in the soda scope from January 1, 2026 to September 14, 2026. Checks are events, not individual people or purchases.
Download imageMost checked herbal teas in Pregnancy Safe
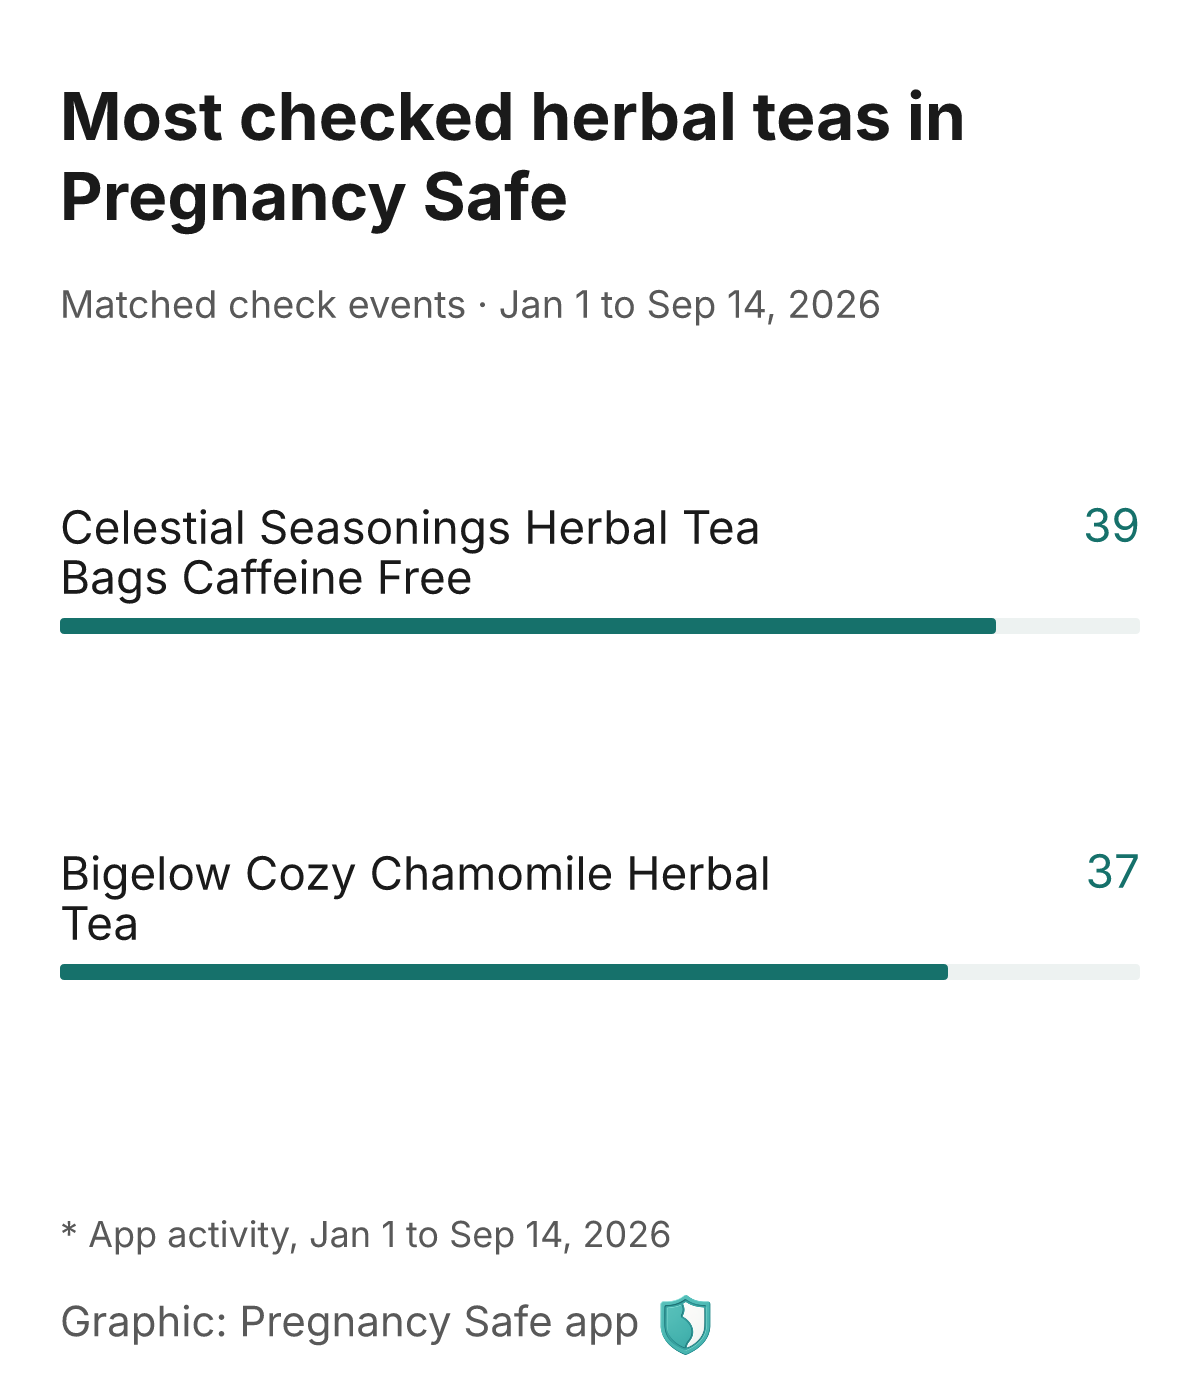
Among checks exactly matched to the Pregnancy Safe catalog, Celestial Seasonings Herbal Tea Bags Caffeine Free had 39 product checks in the herbal tea scope from January 1, 2026 to September 14, 2026. Checks are events, not individual people or purchases.
Download imageMost checked seafoods in Pregnancy Safe
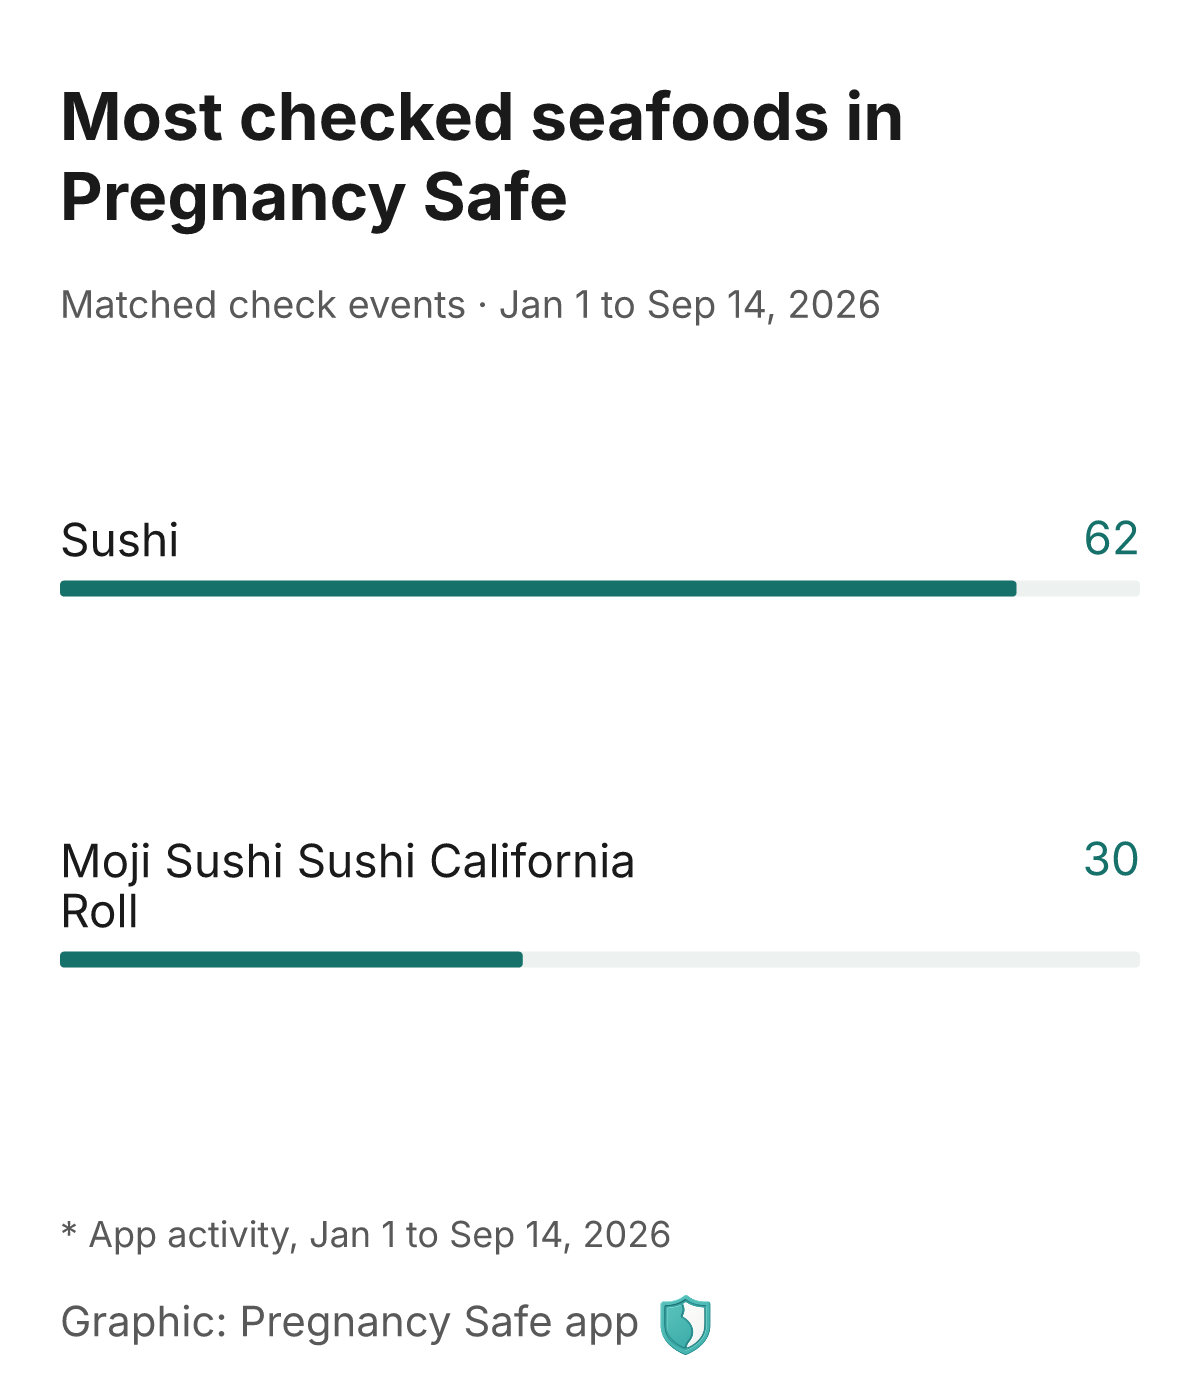
Among checks exactly matched to the Pregnancy Safe catalog, Sushi had 62 product checks in the seafood scope from January 1, 2026 to September 14, 2026. Checks are events, not individual people or purchases.
Download imageMost checked cheeses in Pregnancy Safe
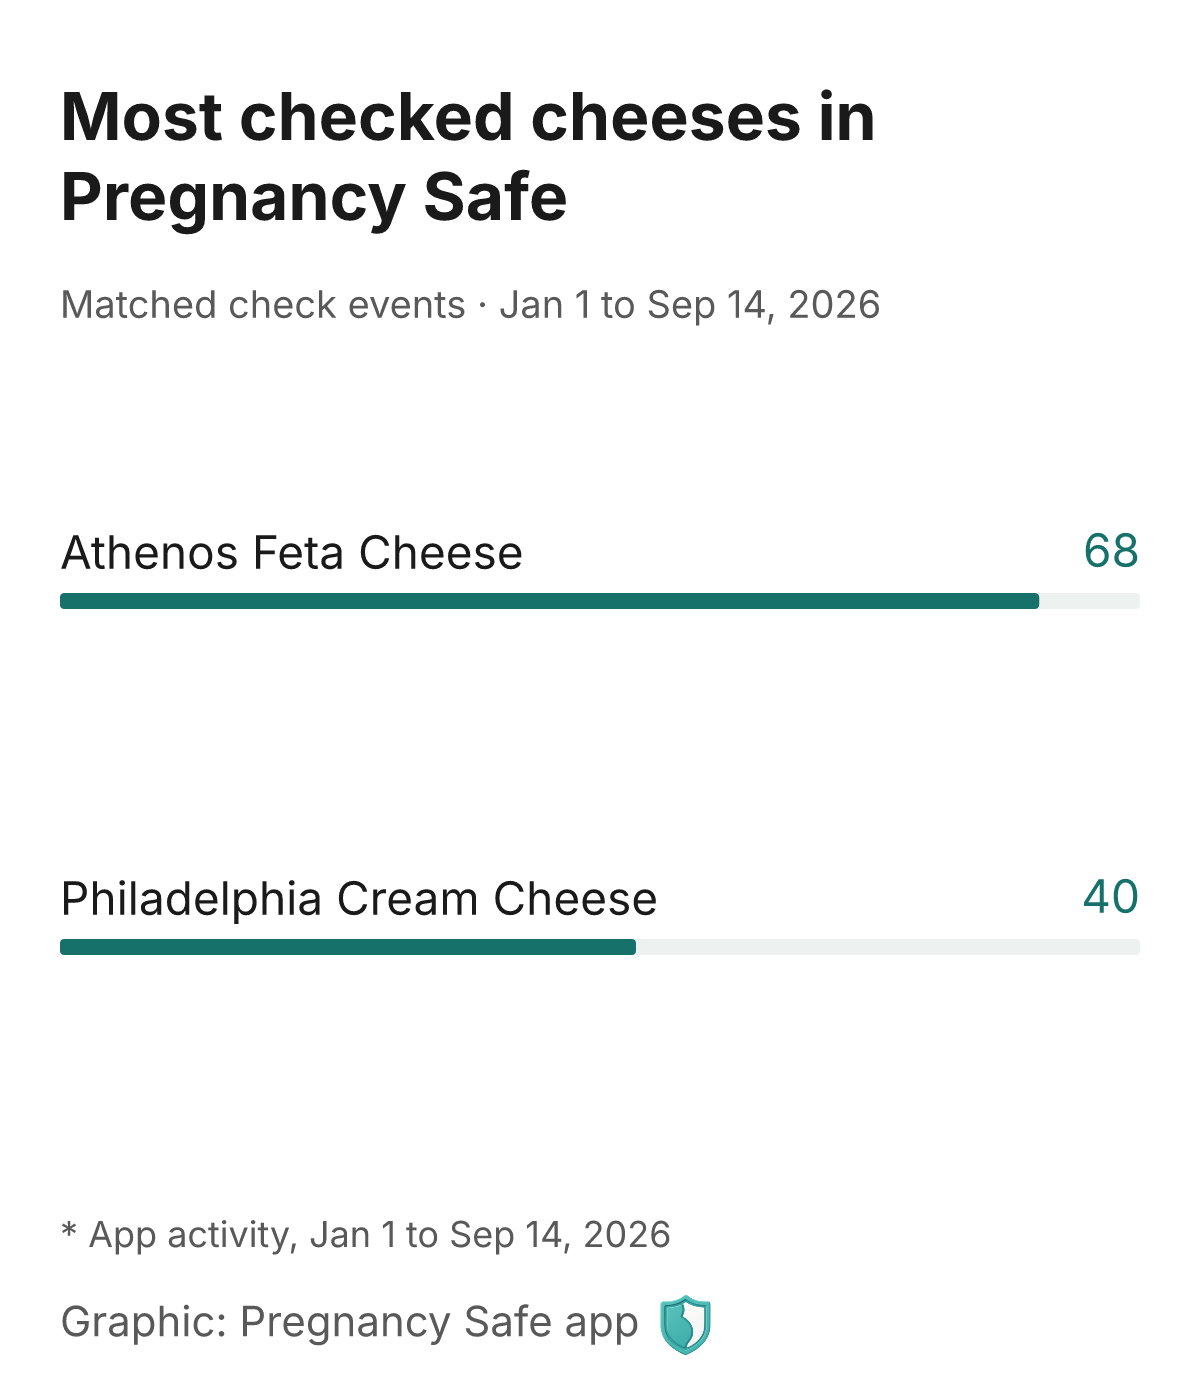
Among checks exactly matched to the Pregnancy Safe catalog, Athenos Feta Cheese had 68 product checks in the cheese scope from January 1, 2026 to September 14, 2026. Checks are events, not individual people or purchases.
Download imageMost checked energy drinks in Pregnancy Safe
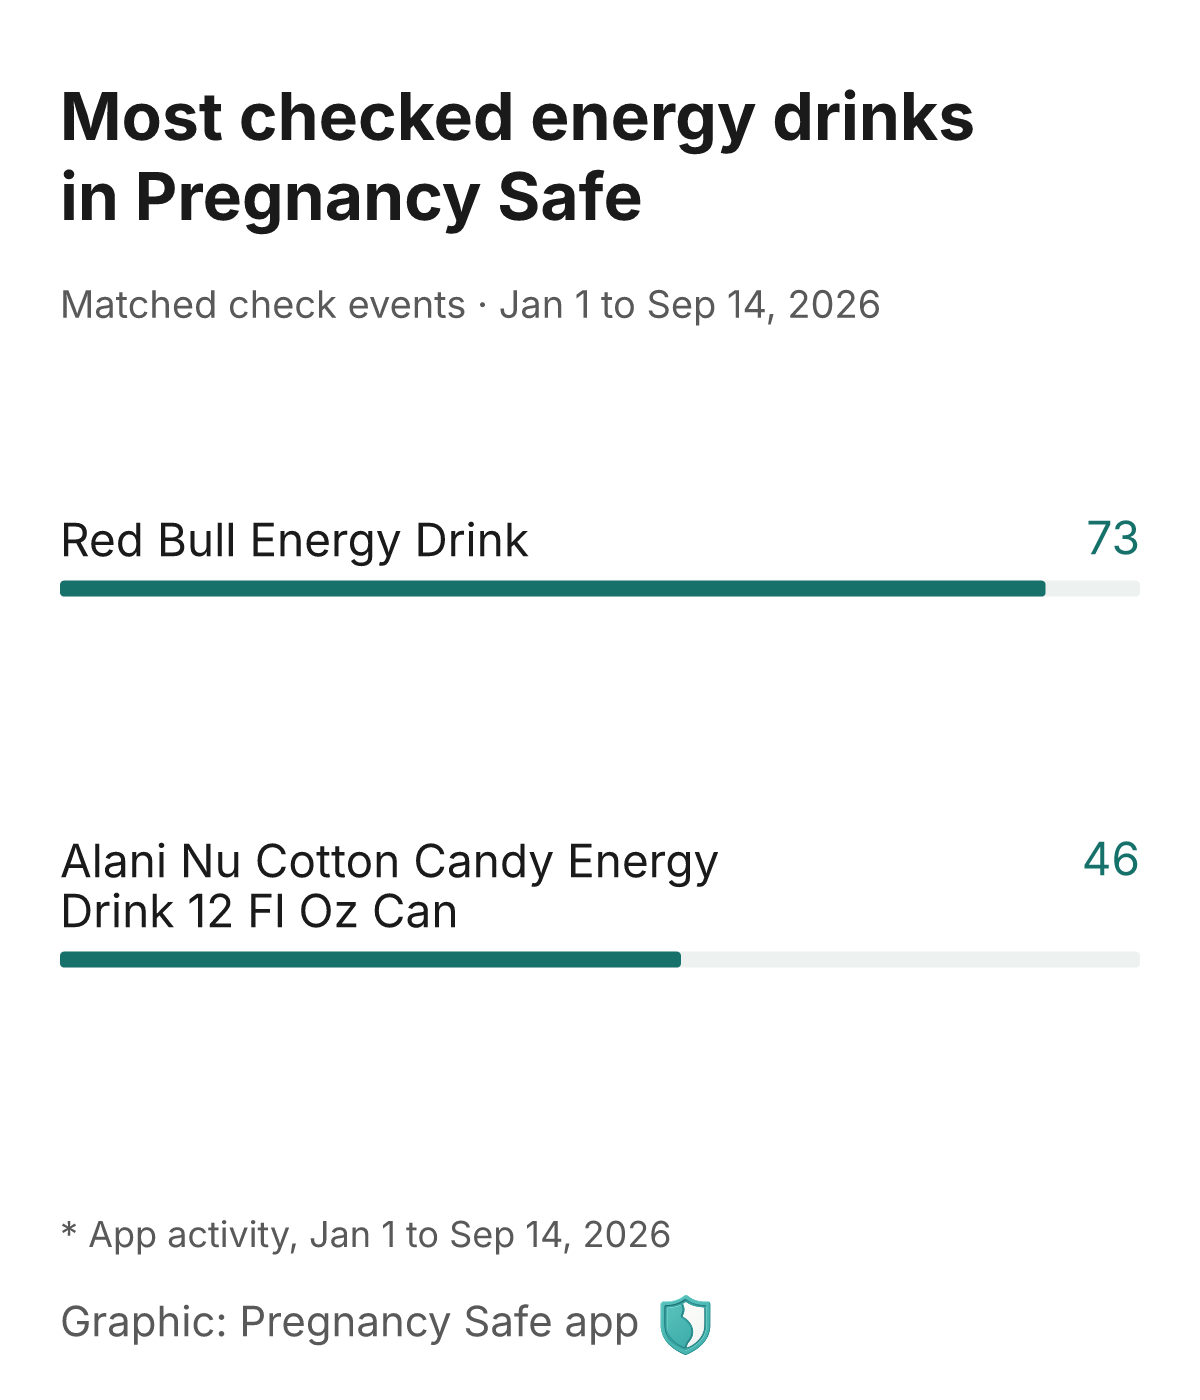
Among checks exactly matched to the Pregnancy Safe catalog, Red Bull Energy Drink had 73 product checks in the energy drink scope from January 1, 2026 to September 14, 2026. Checks are events, not individual people or purchases.
Download imageMost checked moisturizers in Pregnancy Safe
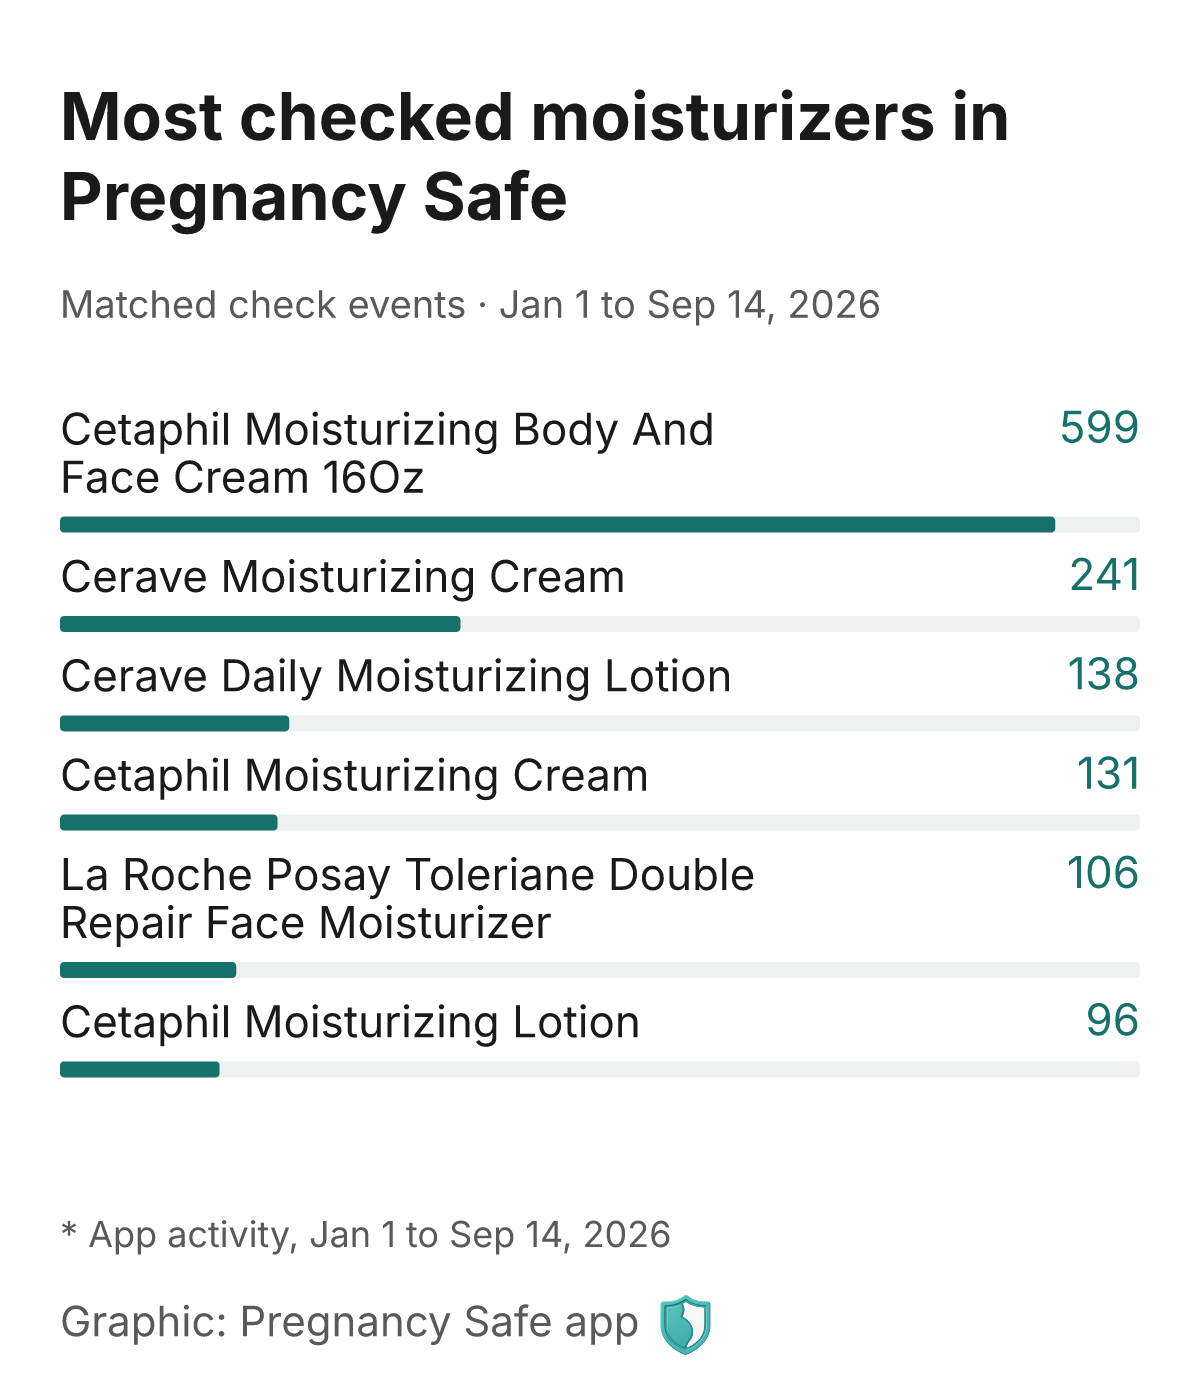
Among checks exactly matched to the Pregnancy Safe catalog, Cetaphil Moisturizing Body And Face Cream 16Oz had 599 product checks in the moisturizer scope from January 1, 2026 to September 14, 2026. Checks are events, not individual people or purchases.
Download imageBrand rankings
Most checked brands in Pregnancy Safe
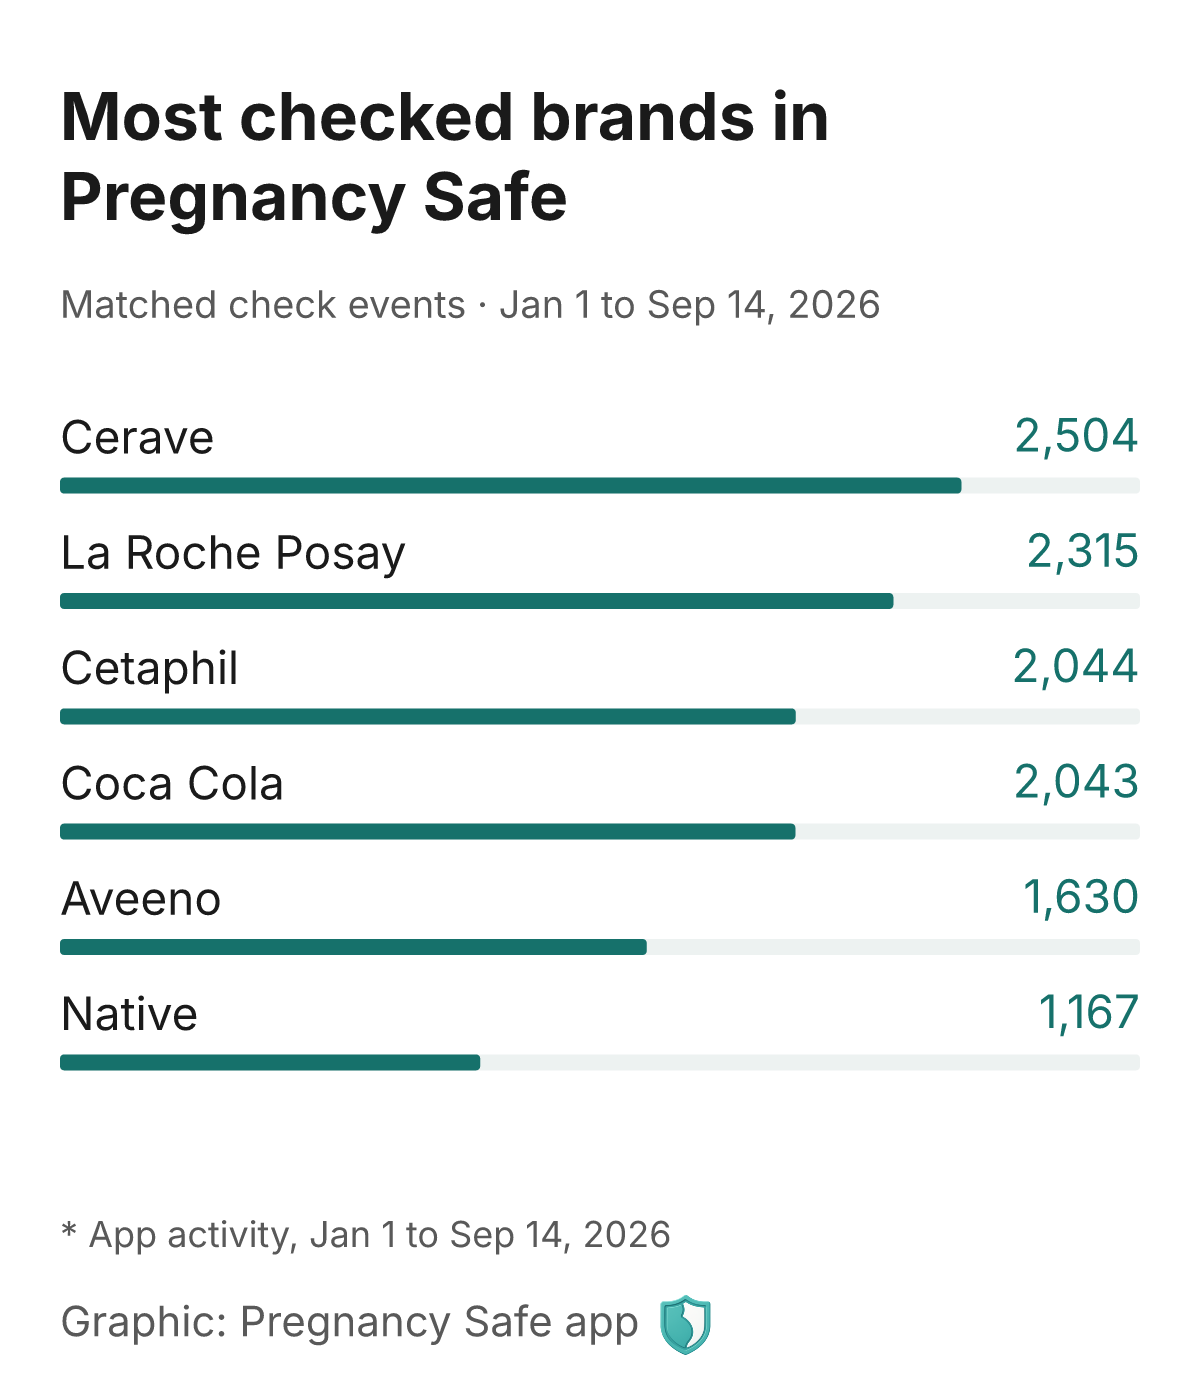
Among checks exactly matched to the Pregnancy Safe catalog, Cerave had 2,504 brand checks in the all scope from January 1, 2026 to September 14, 2026. Checks are events, not individual people or purchases.
Download imageMost checked food and drink brands in Pregnancy Safe
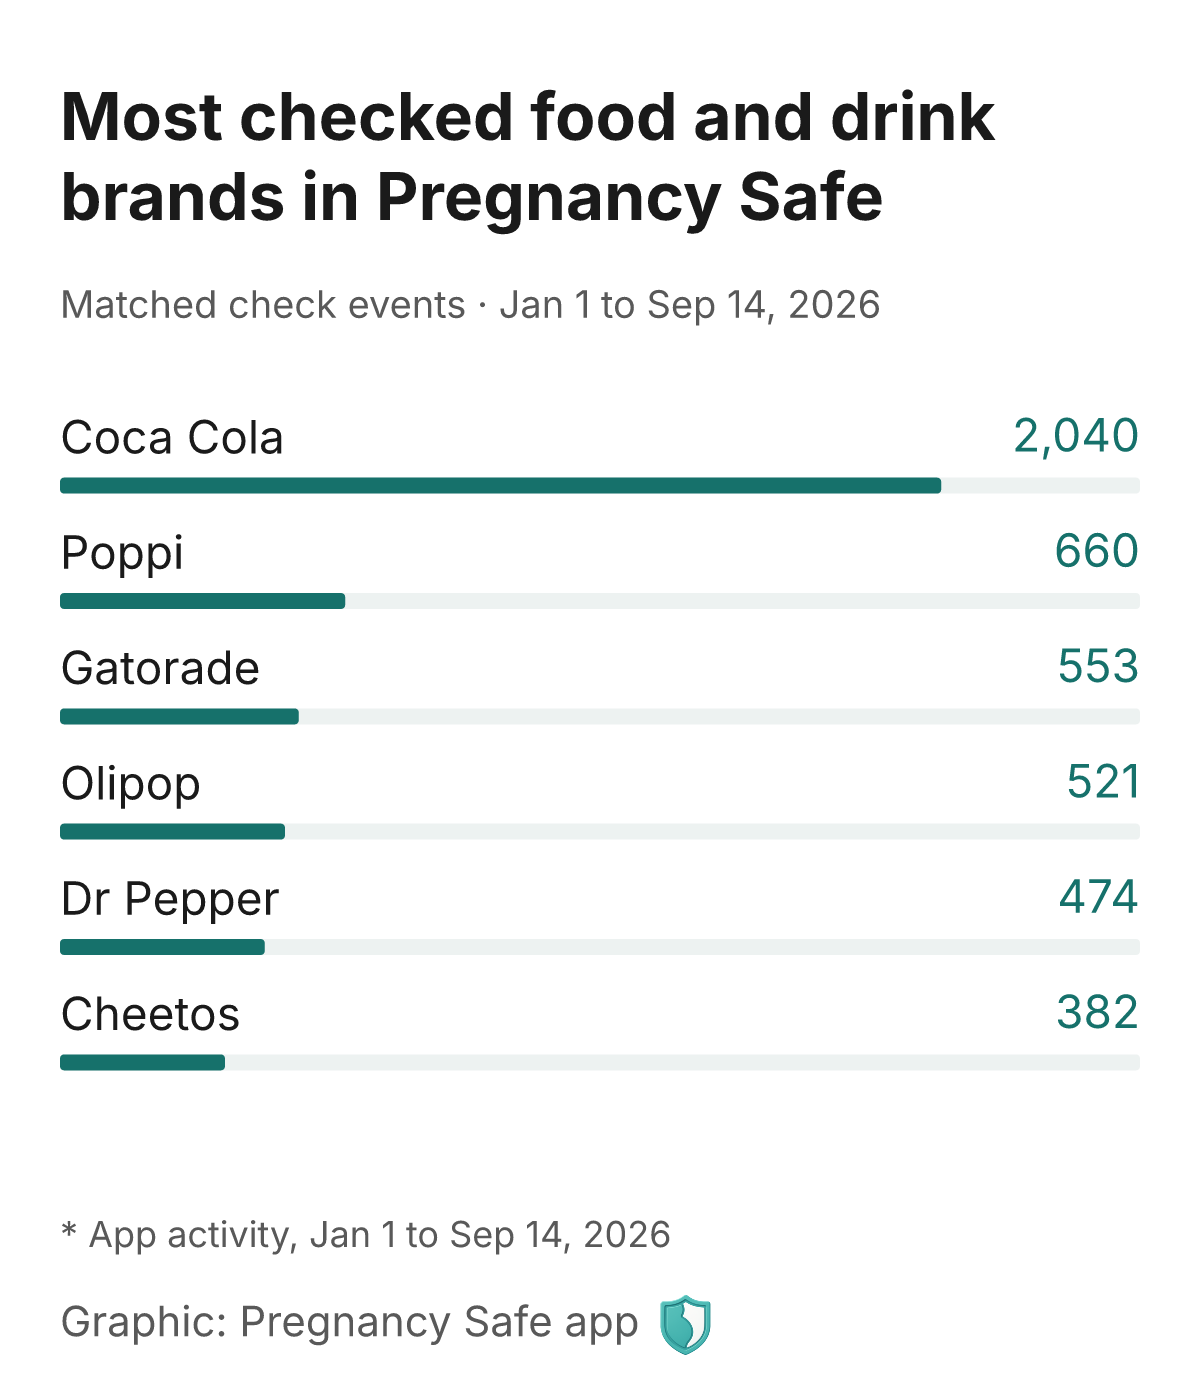
Among checks exactly matched to the Pregnancy Safe catalog, Coca Cola had 2,040 brand checks in the food drink scope from January 1, 2026 to September 14, 2026. Checks are events, not individual people or purchases.
Download imageMost checked skincare brands in Pregnancy Safe
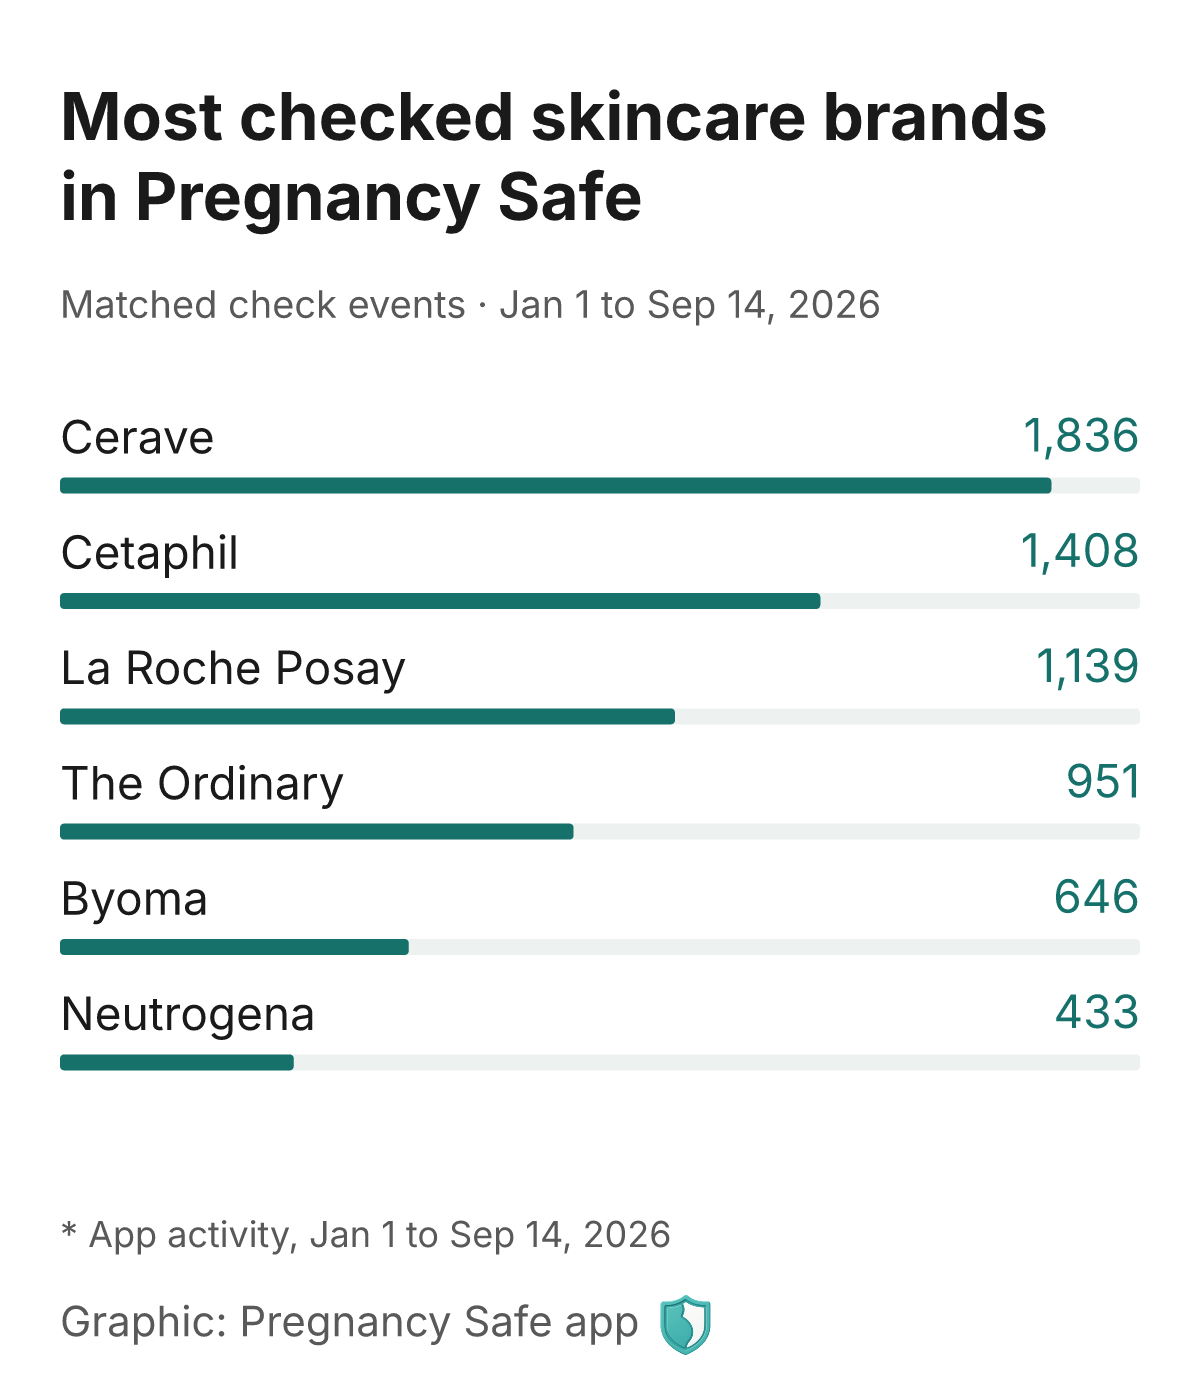
Among checks exactly matched to the Pregnancy Safe catalog, Cerave had 1,836 brand checks in the skincare scope from January 1, 2026 to September 14, 2026. Checks are events, not individual people or purchases.
Download imageMost checked haircare brands in Pregnancy Safe
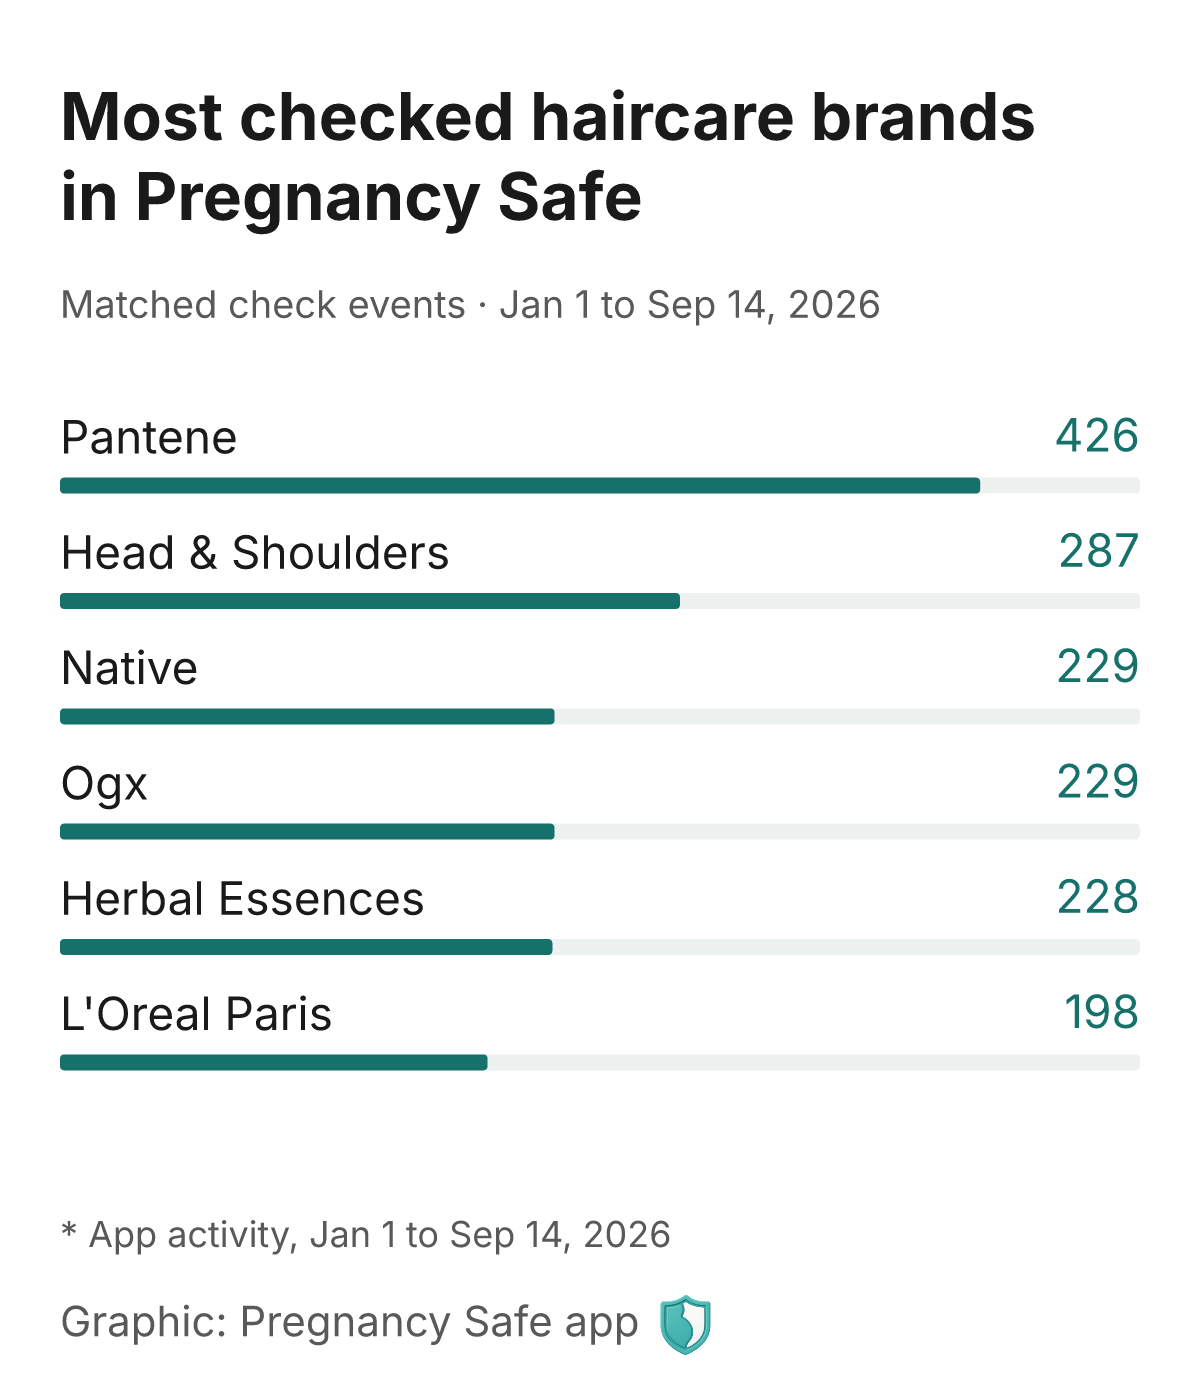
Among checks exactly matched to the Pregnancy Safe catalog, Pantene had 426 brand checks in the haircare scope from January 1, 2026 to September 14, 2026. Checks are events, not individual people or purchases.
Download imageMost checked supplement and prenatal brands in Pregnancy Safe
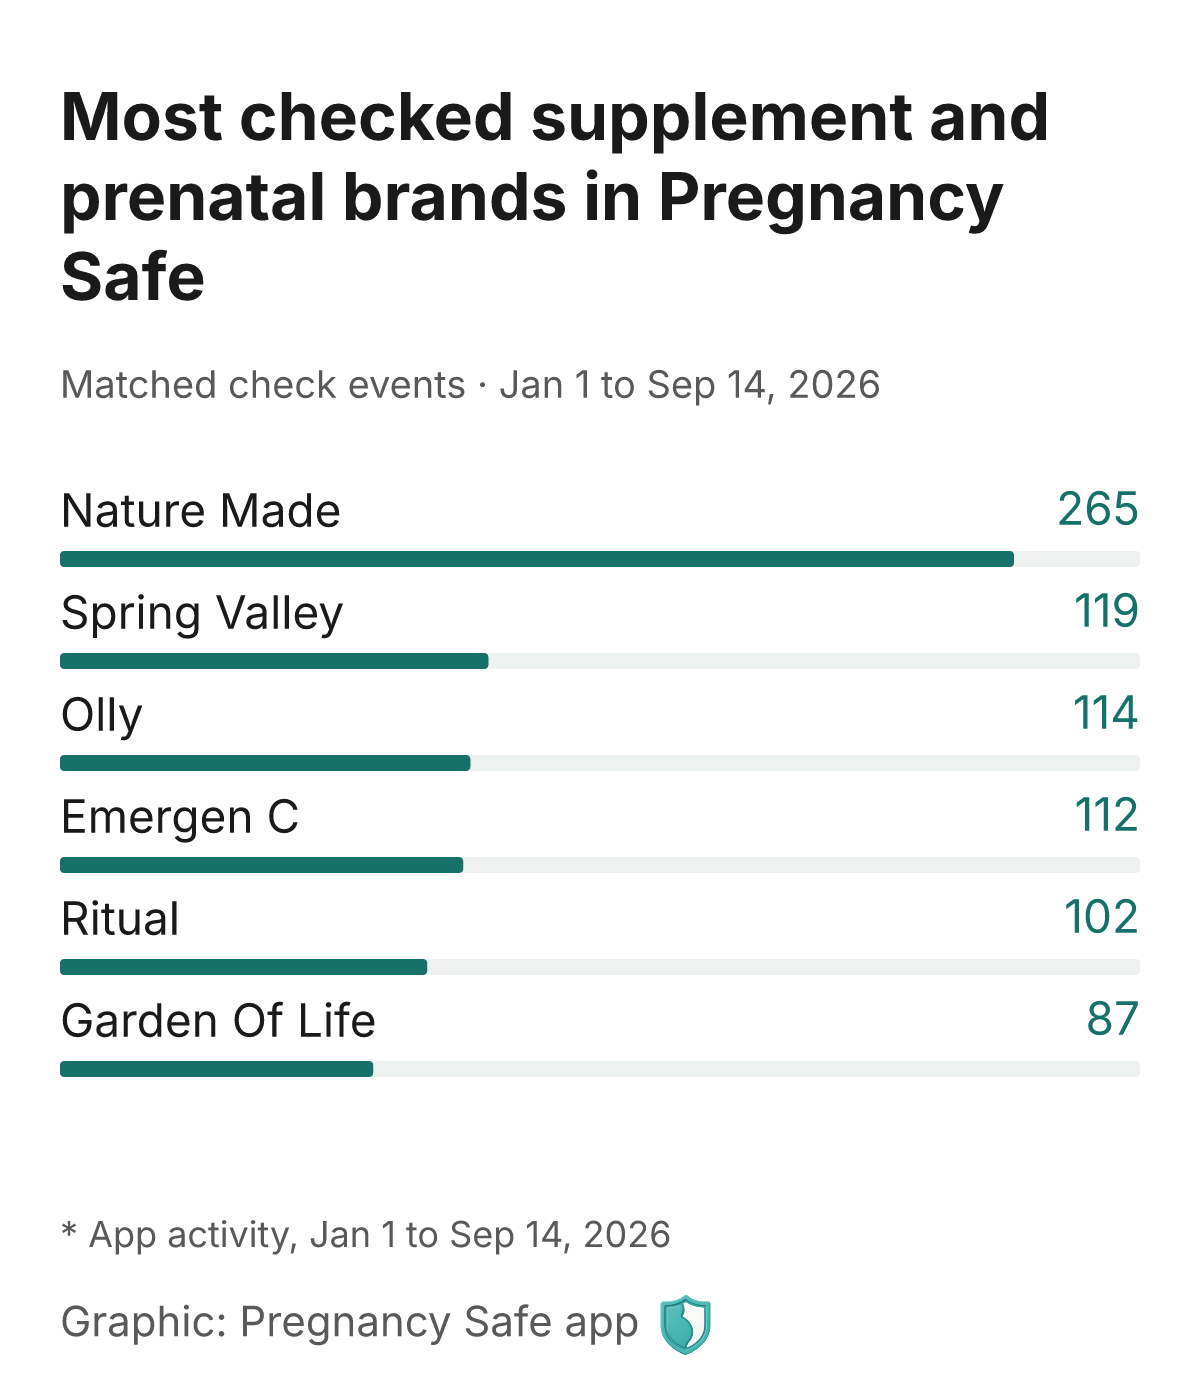
Among checks exactly matched to the Pregnancy Safe catalog, Nature Made had 265 brand checks in the supplement prenatal scope from January 1, 2026 to September 14, 2026. Checks are events, not individual people or purchases.
Download imageMost checked medicine brands in Pregnancy Safe
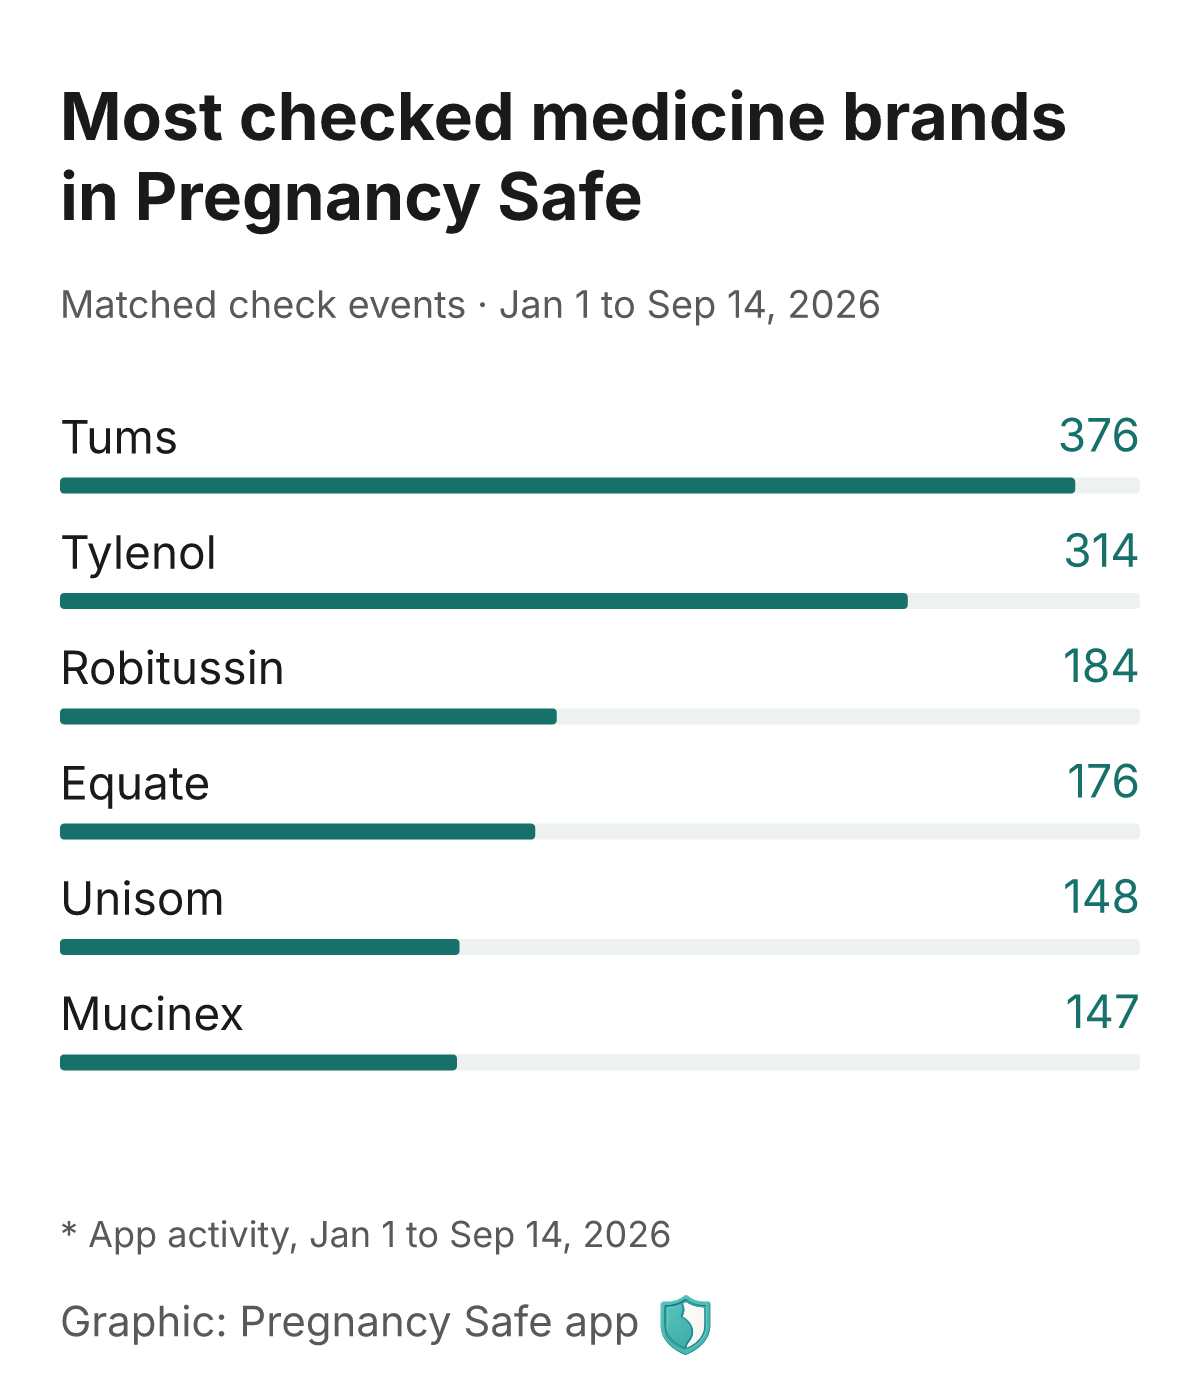
Among checks exactly matched to the Pregnancy Safe catalog, Tums had 376 brand checks in the medicine scope from January 1, 2026 to September 14, 2026. Checks are events, not individual people or purchases.
Download imageChecking behavior
Product checks by category
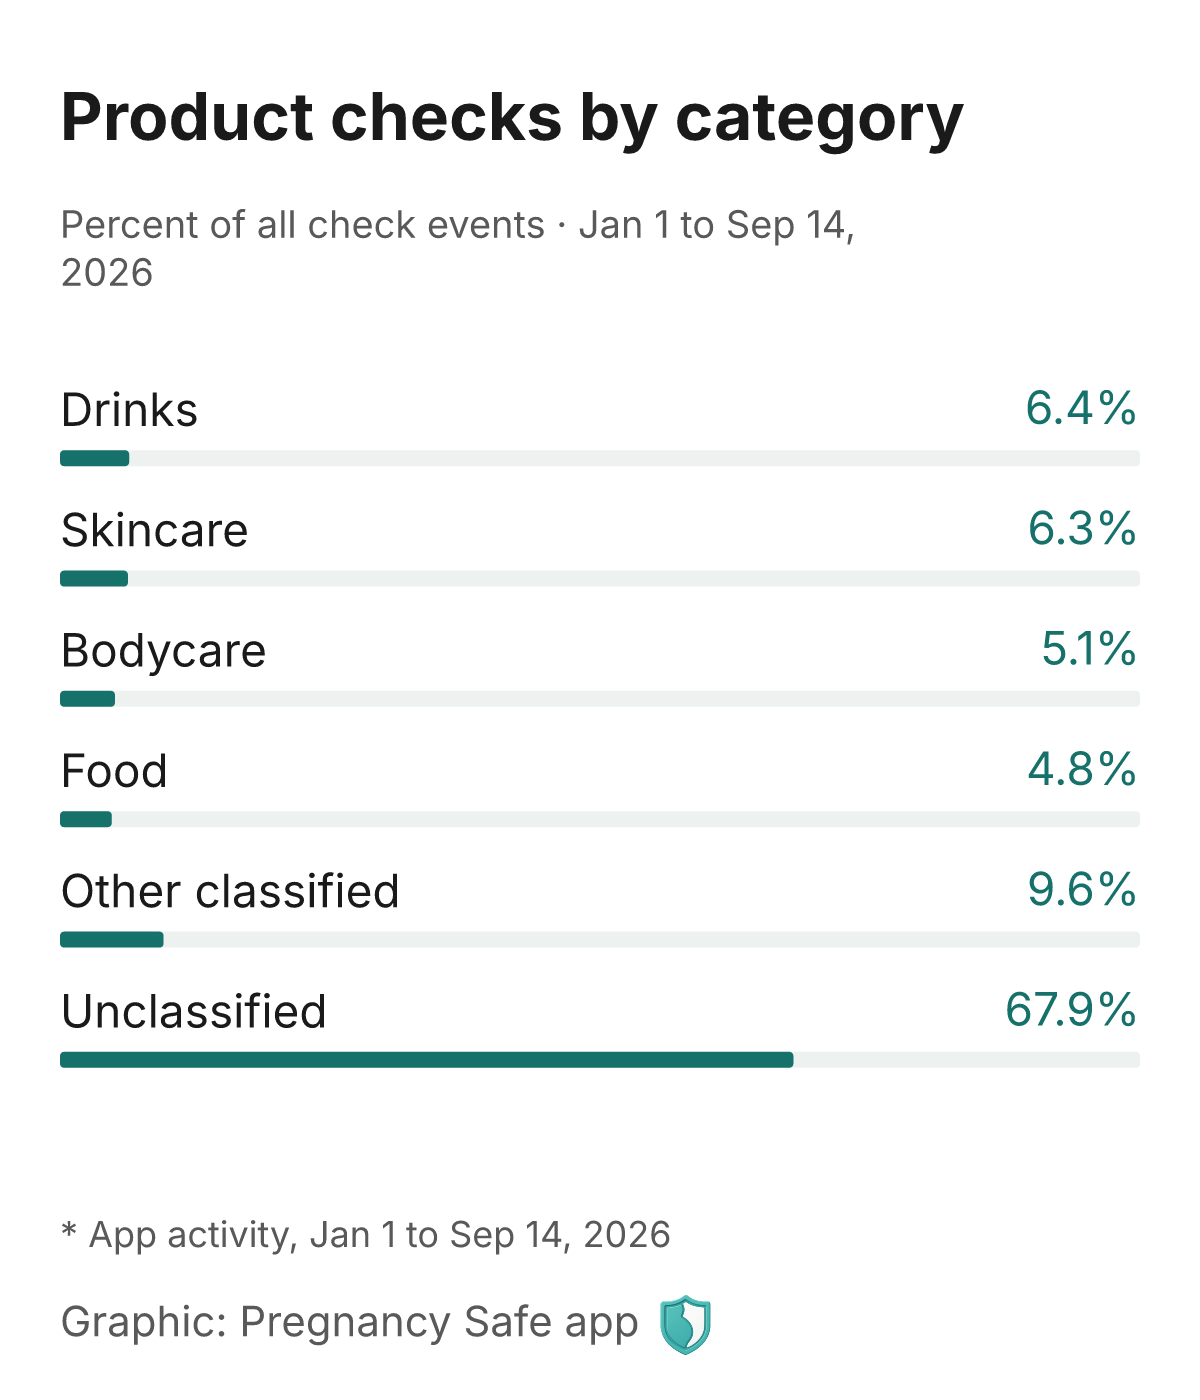
From January 1, 2026 to September 14, 2026, Pregnancy Safe recorded 237,974 barcode and search checks. 67.9% were unclassified under the draft category mapping.
Download imageBarcode scans and product searches
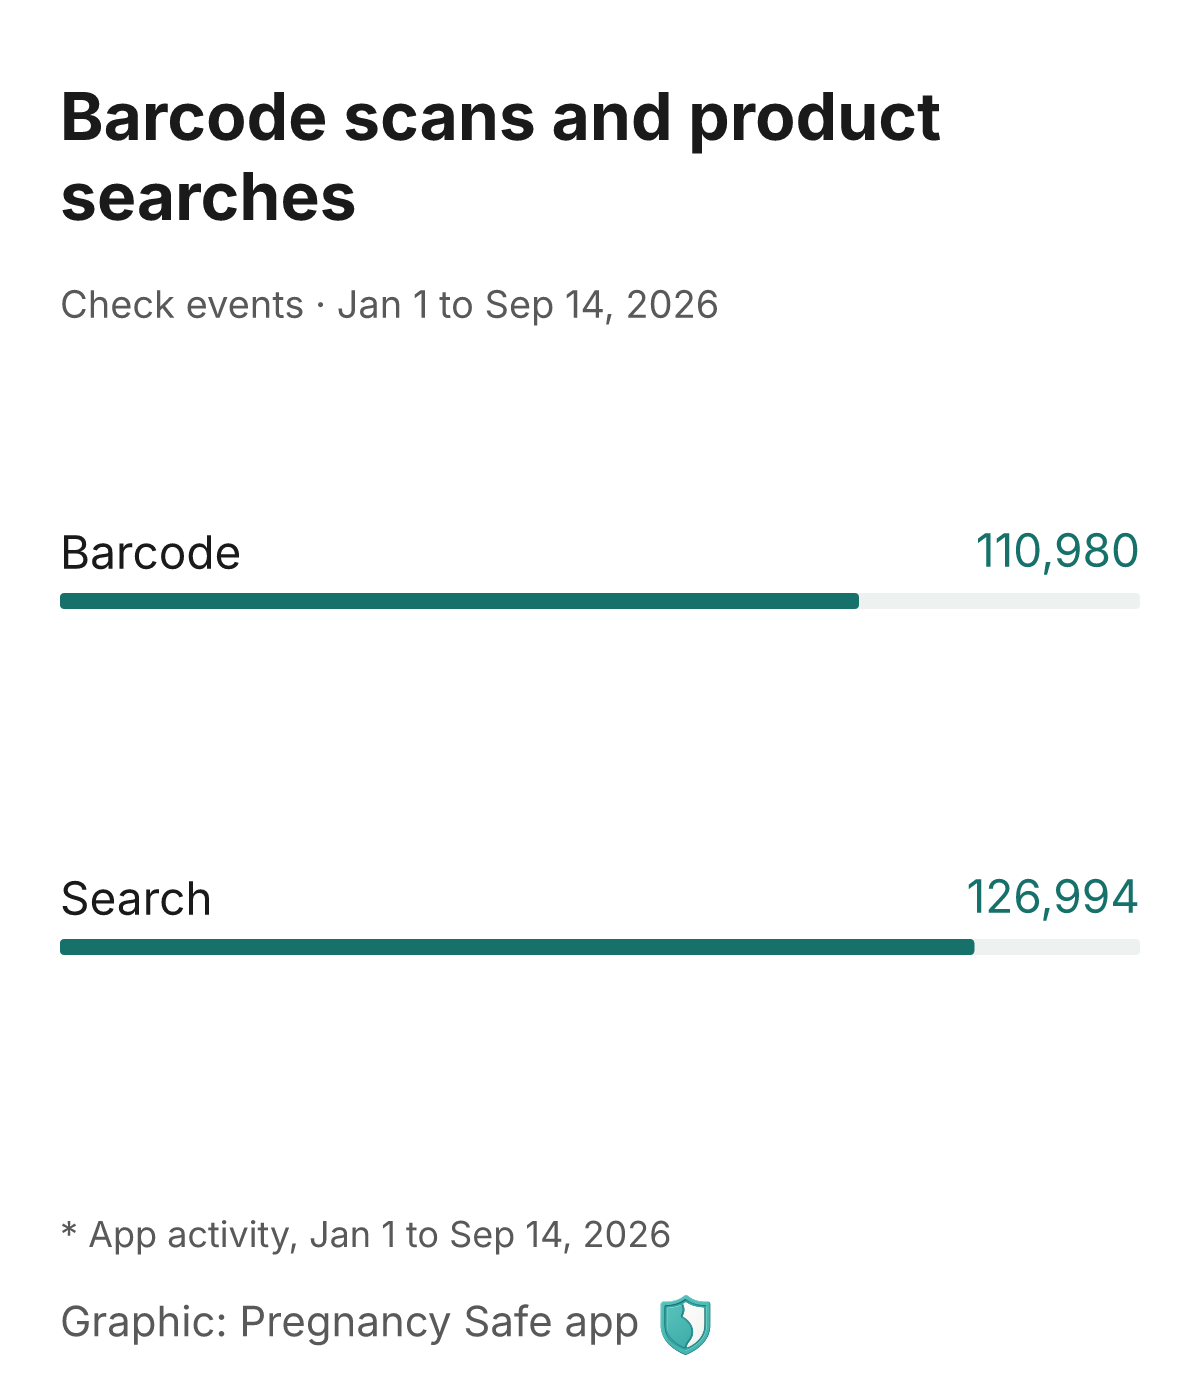
Pregnancy Safe recorded 110,980 barcode checks and 126,994 search checks from January 1, 2026 to September 14, 2026. These are check events, not unique people.
Download imageCategory share of product checks
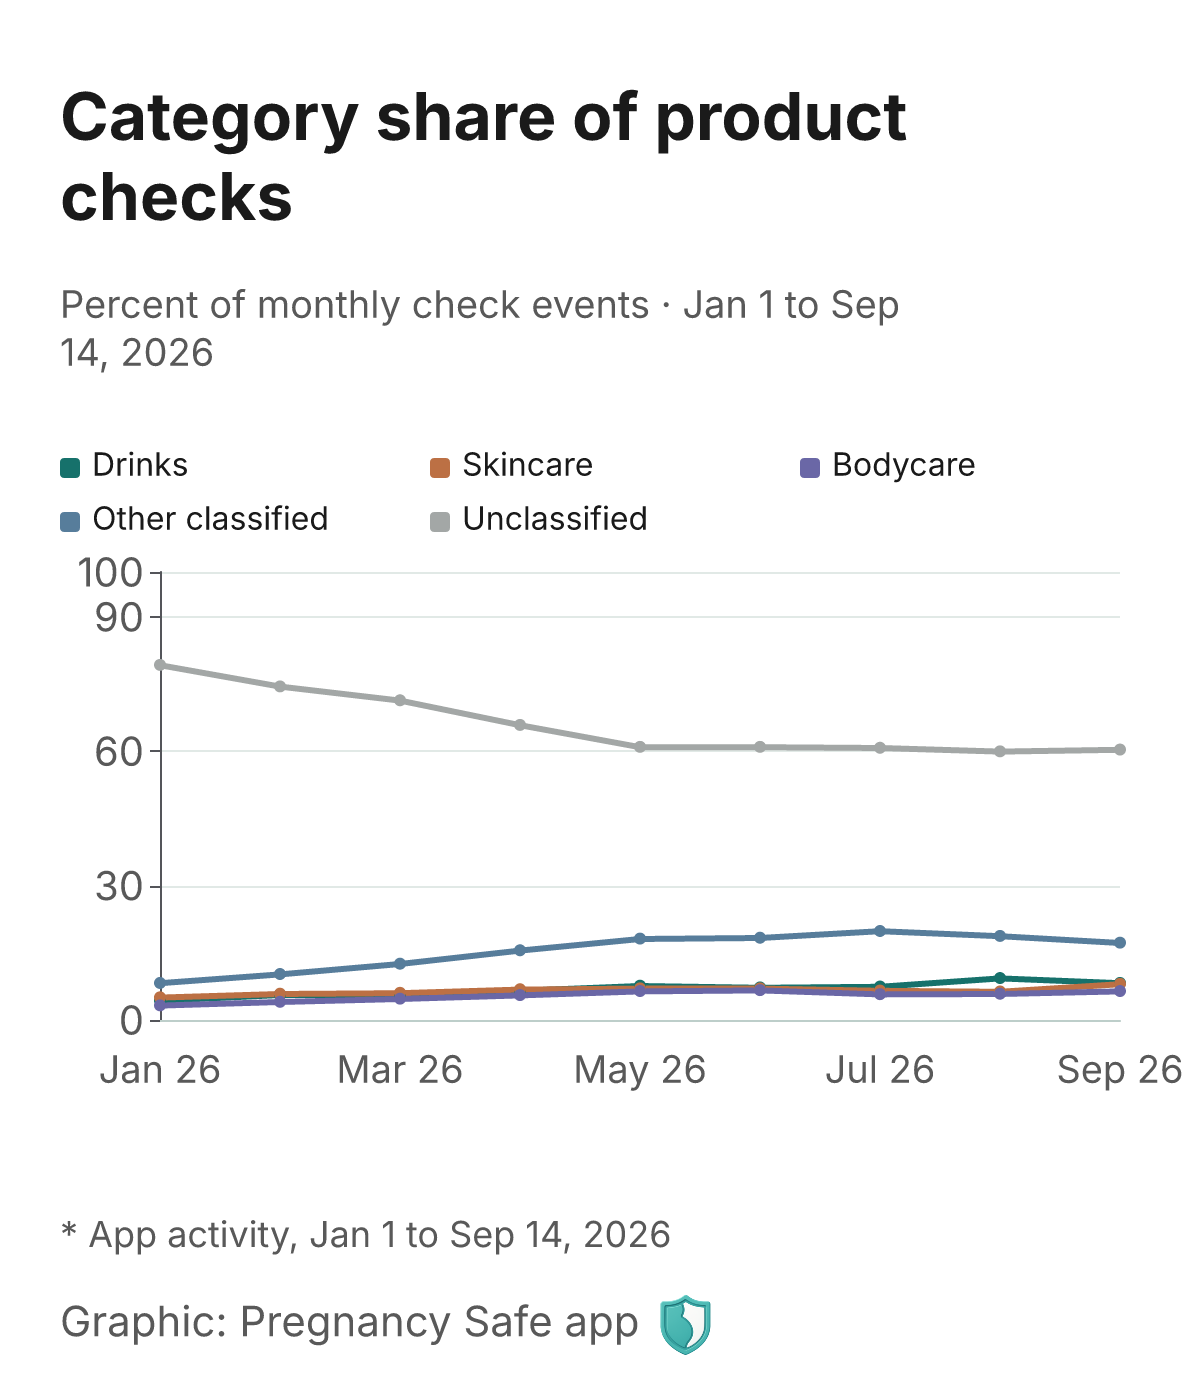
Monthly category shares use all barcode and search checks from January 1, 2026 to September 14, 2026, including unclassified checks. They measure app checking activity, not market share.
Download imageTop products by check method
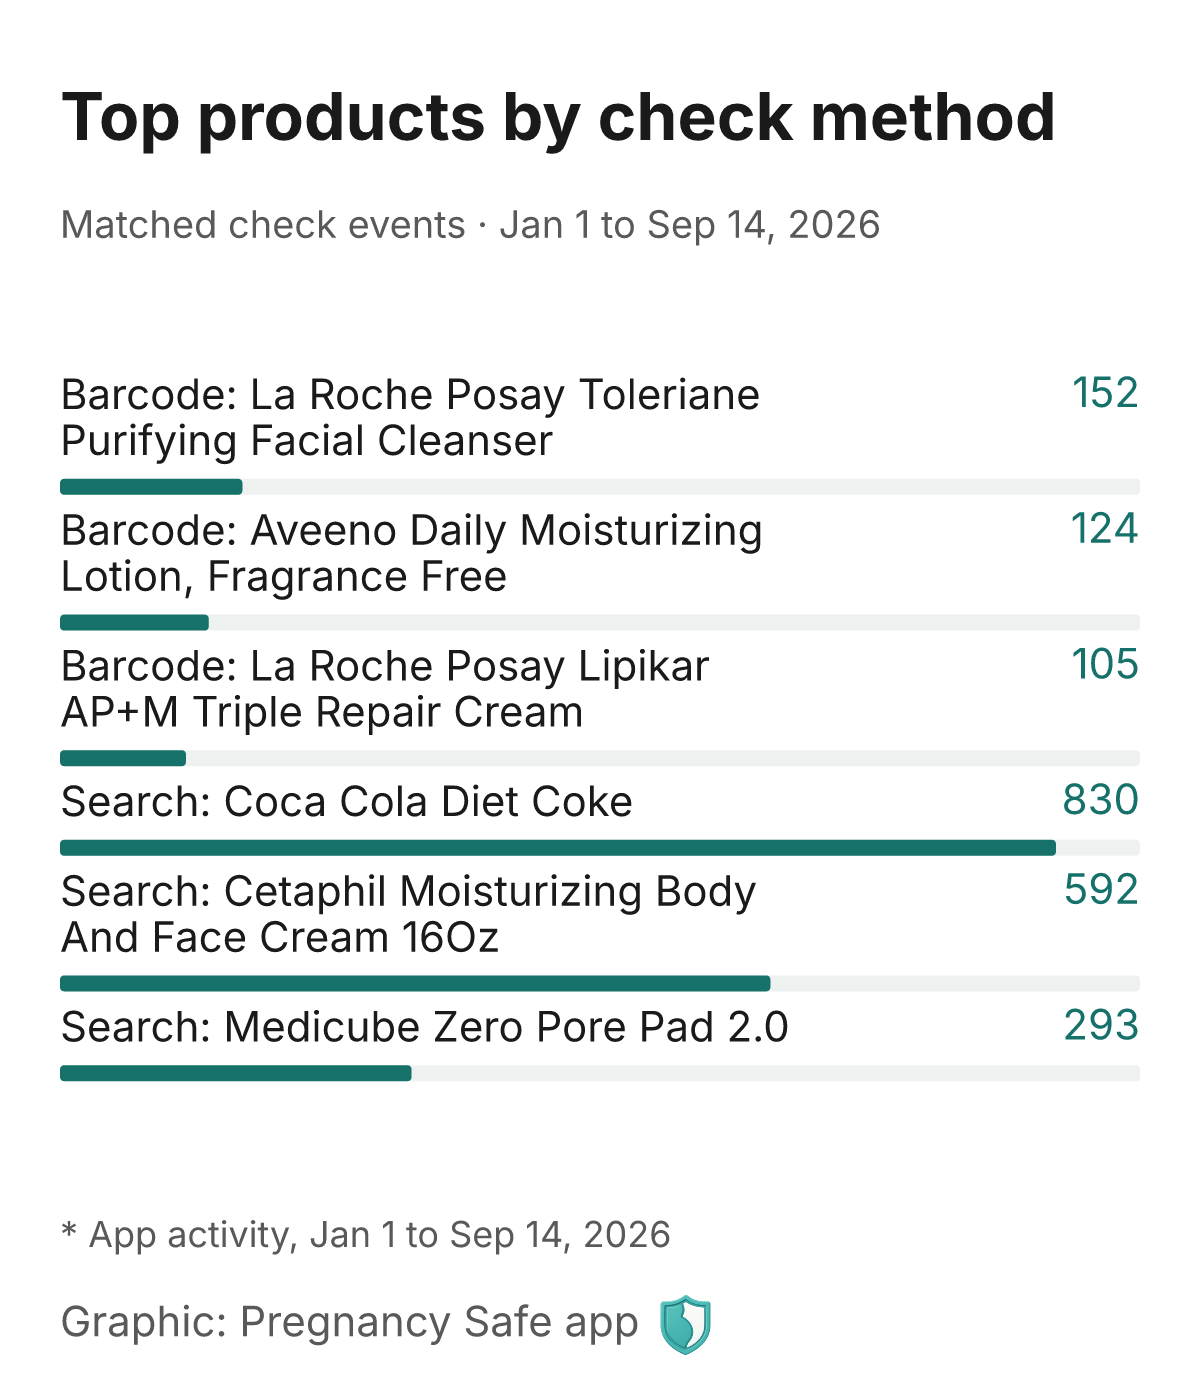
The chart compares the three most checked catalog matched products separately for barcode and search events from January 1, 2026 to September 14, 2026. A product can appear in both methods.
Download imageSymptom patterns
Bloating reporting by pregnancy week
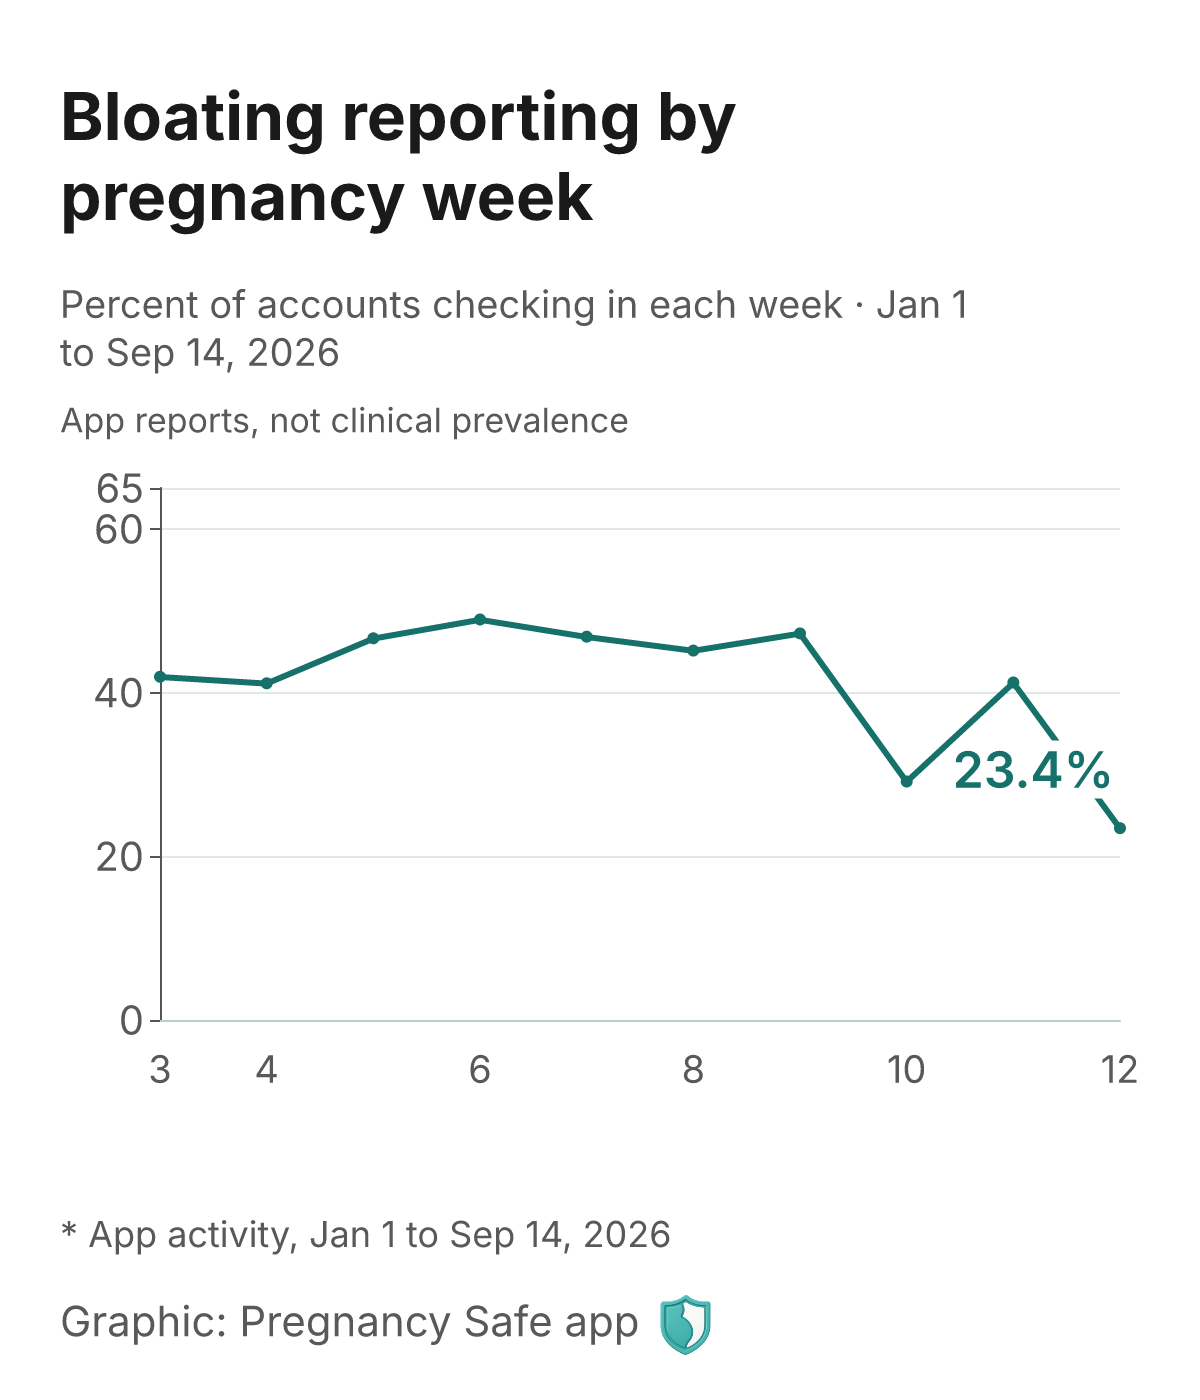
Among the displayed weeks in Pregnancy Safe, bloating reporting was highest in assigned week 6: 48.9% of 323 accounts checking in that week. Data cover January 1, 2026 to September 14, 2026. Reporting means logging that response at least once in the week.
Download imageCramping reporting by pregnancy week
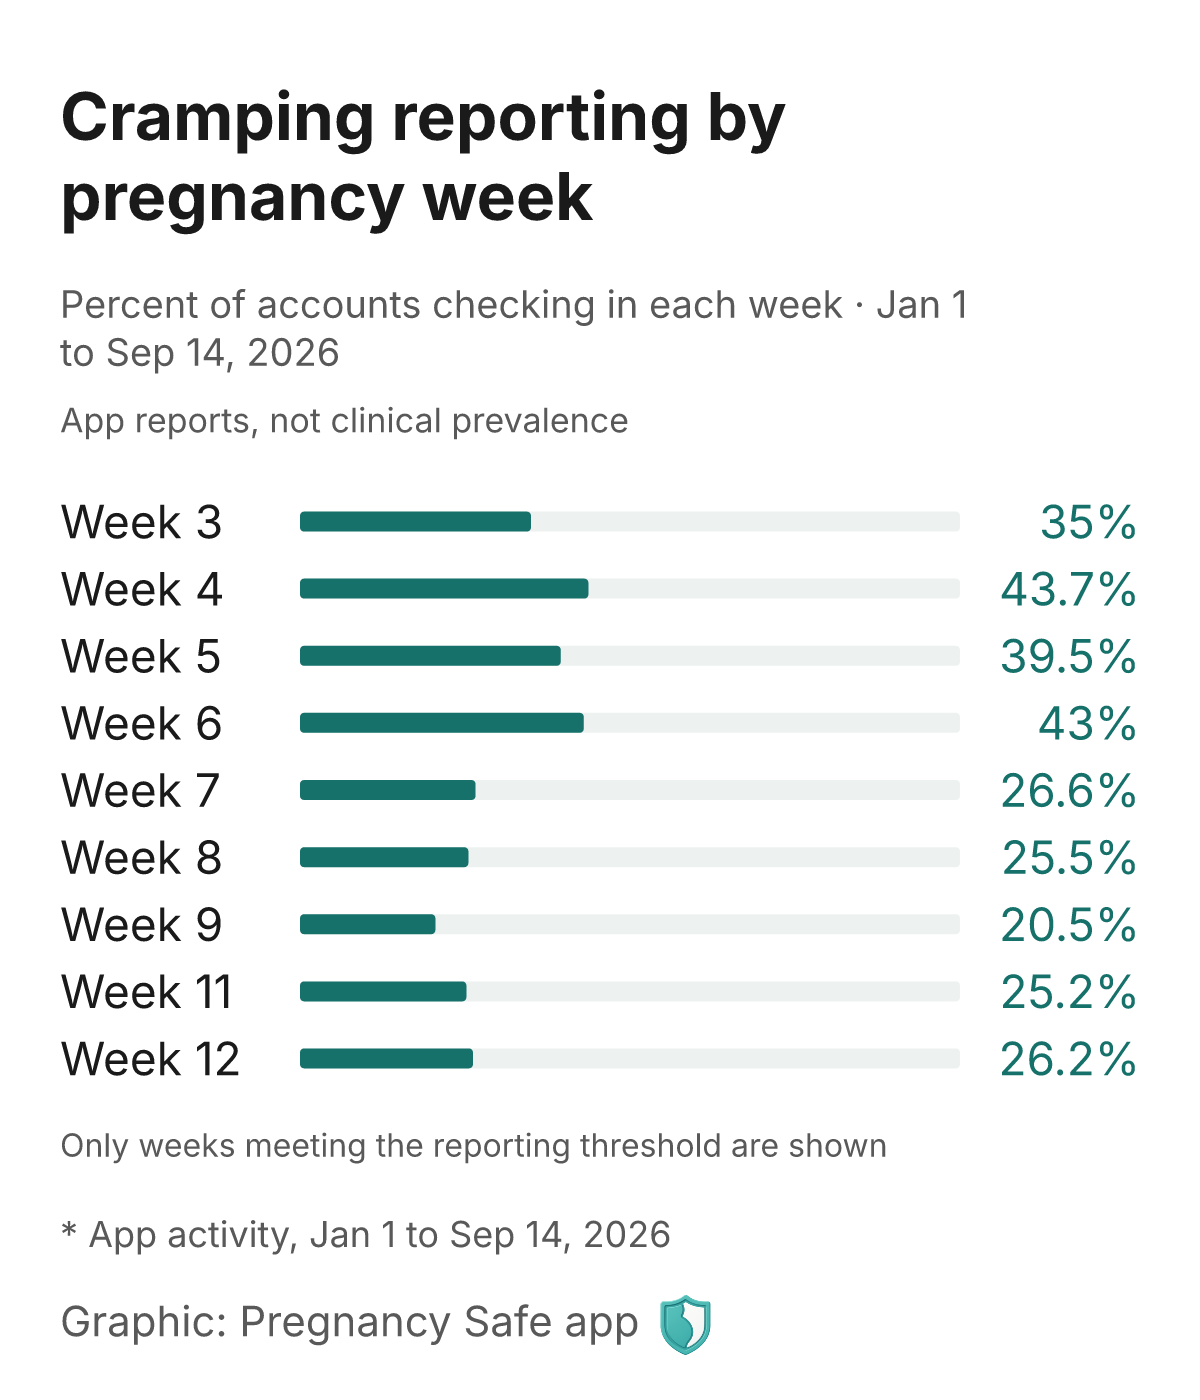
Among the displayed weeks in Pregnancy Safe, cramping reporting was highest in assigned week 4: 43.7% of 426 accounts checking in that week. Data cover January 1, 2026 to September 14, 2026. Reporting means logging that response at least once in the week.
Download imageSore breasts reporting by pregnancy week
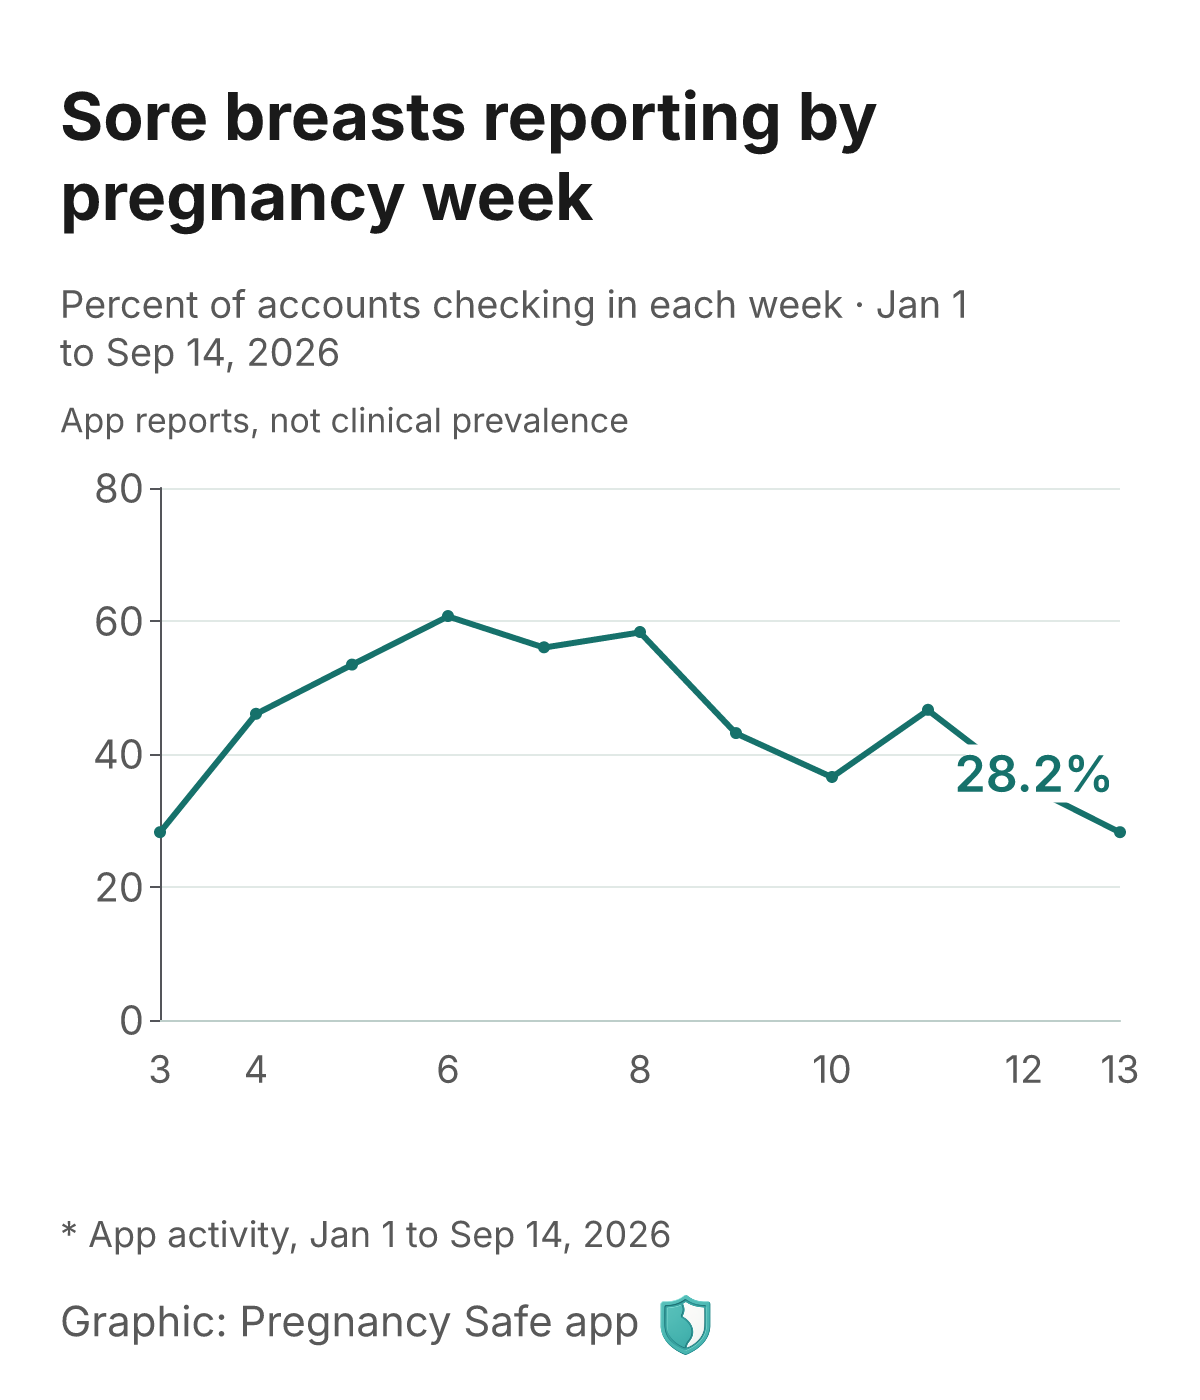
Among the displayed weeks in Pregnancy Safe, sore breasts reporting was highest in assigned week 6: 60.7% of 323 accounts checking in that week. Data cover January 1, 2026 to September 14, 2026. Reporting means logging that response at least once in the week.
Download imageBack pain reporting by pregnancy week
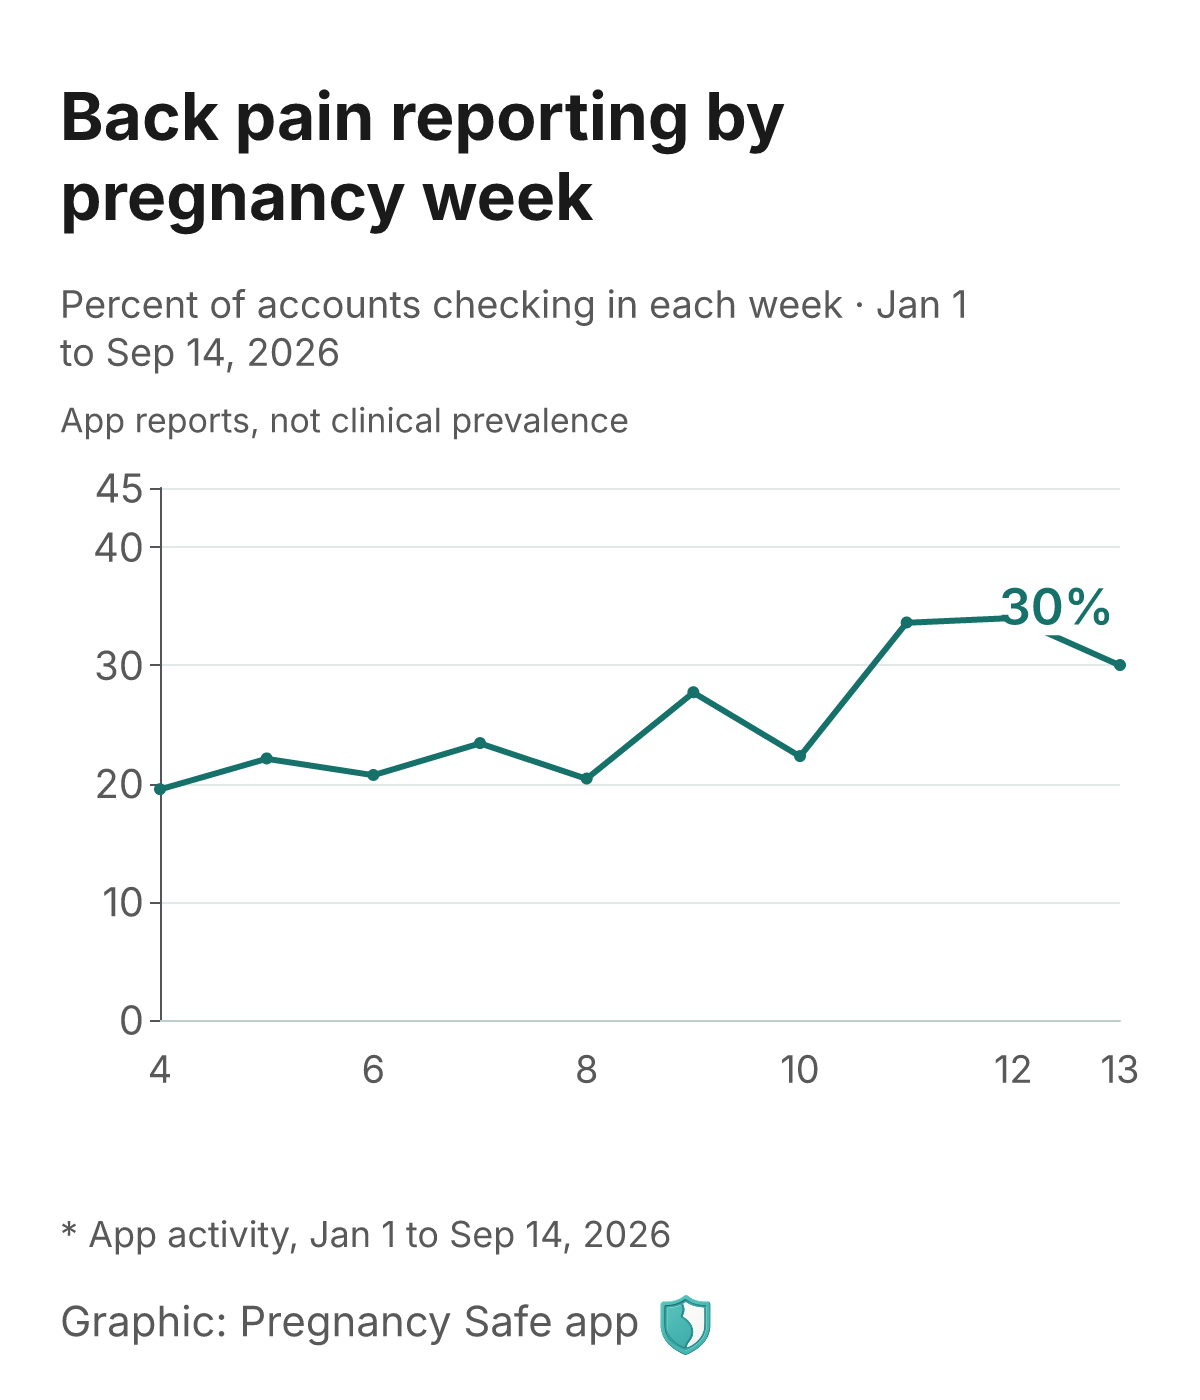
Among the displayed weeks in Pregnancy Safe, back pain reporting was highest in assigned week 12: 34.0% of 141 accounts checking in that week. Data cover January 1, 2026 to September 14, 2026. Reporting means logging that response at least once in the week.
Download imageNausea reporting by pregnancy week
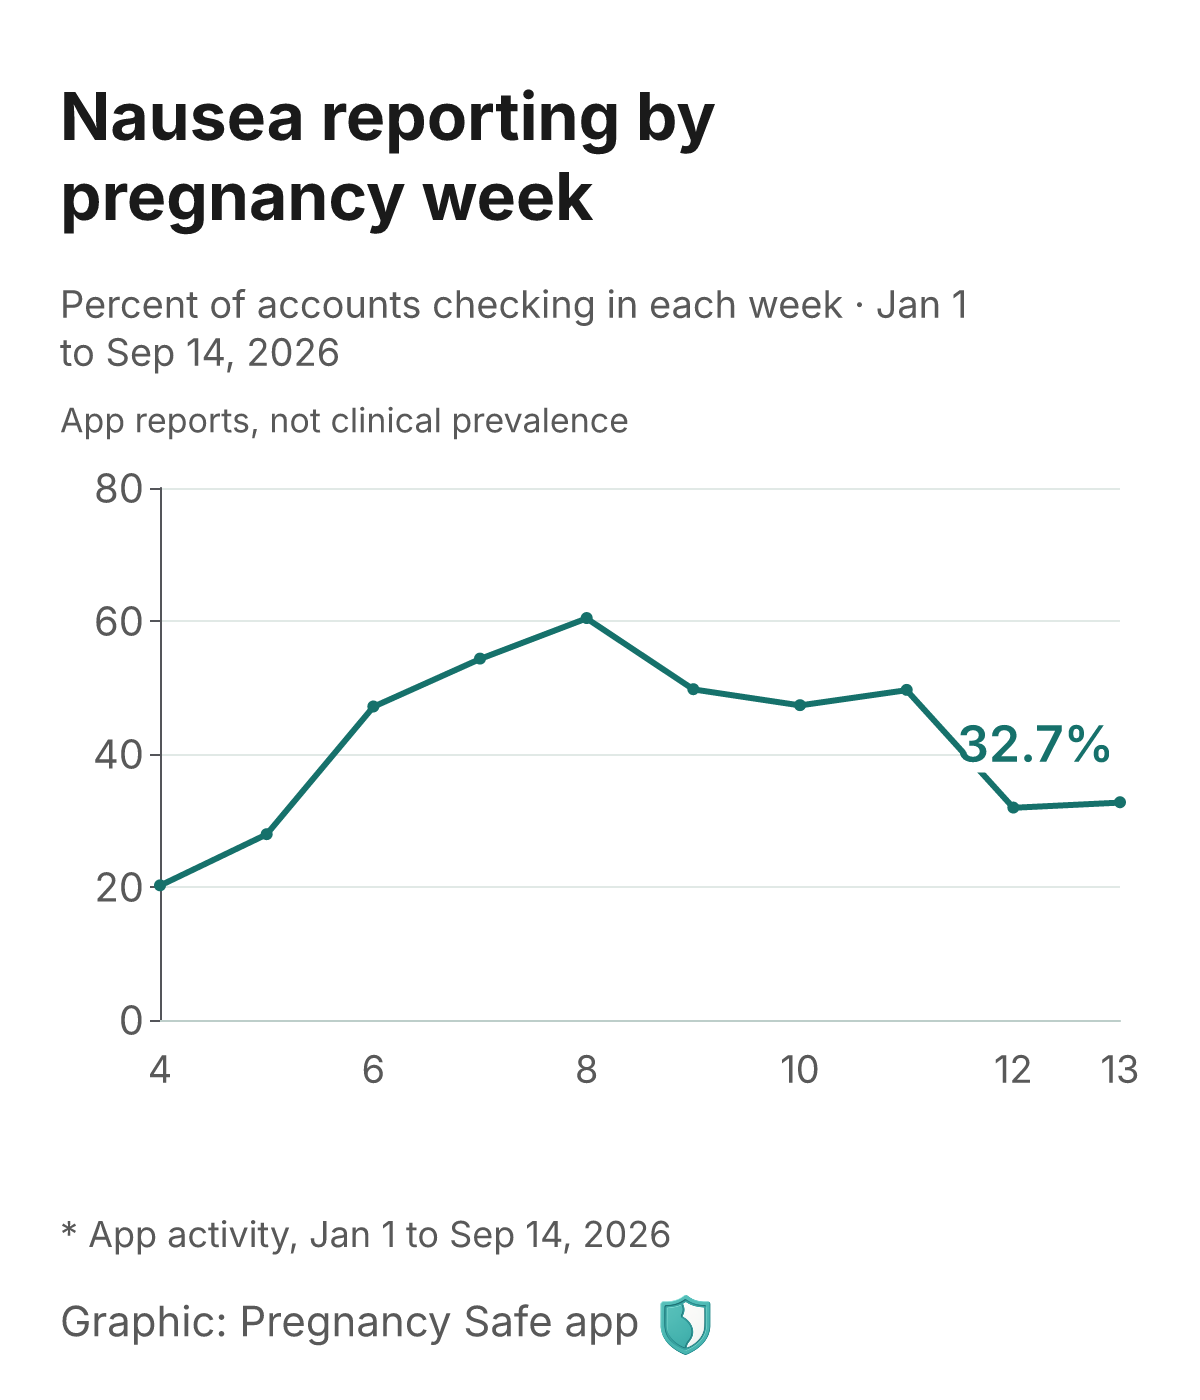
Among the displayed weeks in Pregnancy Safe, nausea reporting was highest in assigned week 8: 60.4% of 235 accounts checking in that week. Data cover January 1, 2026 to September 14, 2026. Reporting means logging that response at least once in the week.
Download imageFatigue reporting by pregnancy week
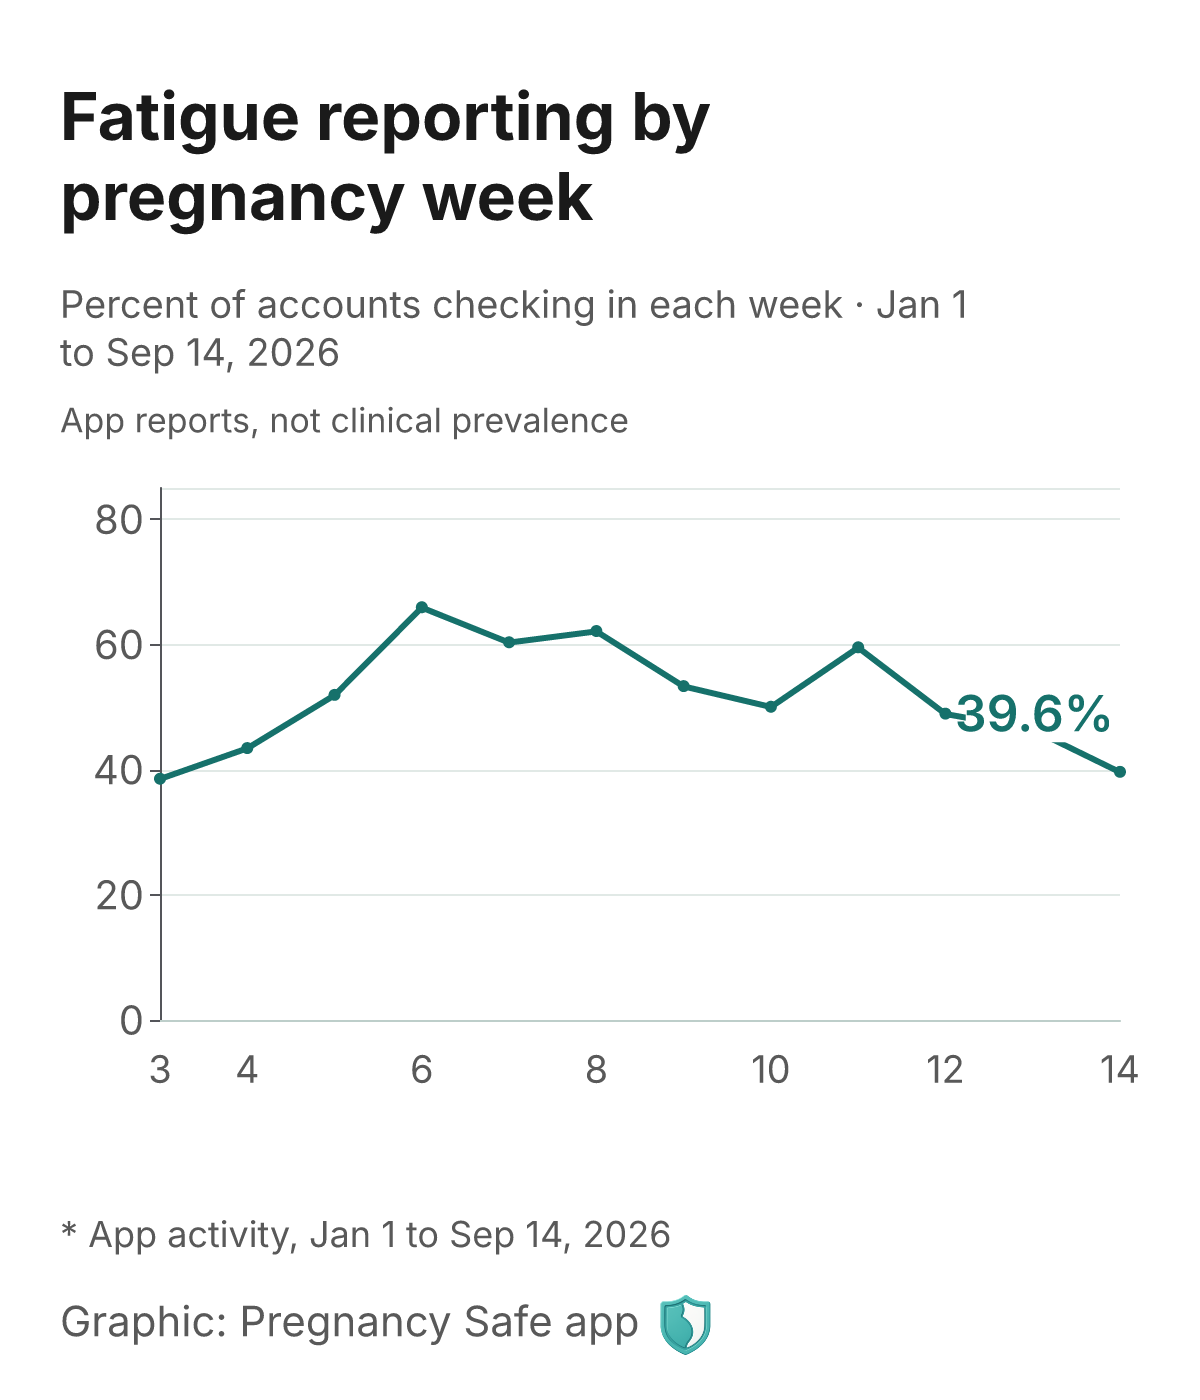
Among the displayed weeks in Pregnancy Safe, fatigue reporting was highest in assigned week 6: 65.9% of 323 accounts checking in that week. Data cover January 1, 2026 to September 14, 2026. Reporting means logging that response at least once in the week.
Download imageHeartburn reporting by pregnancy week
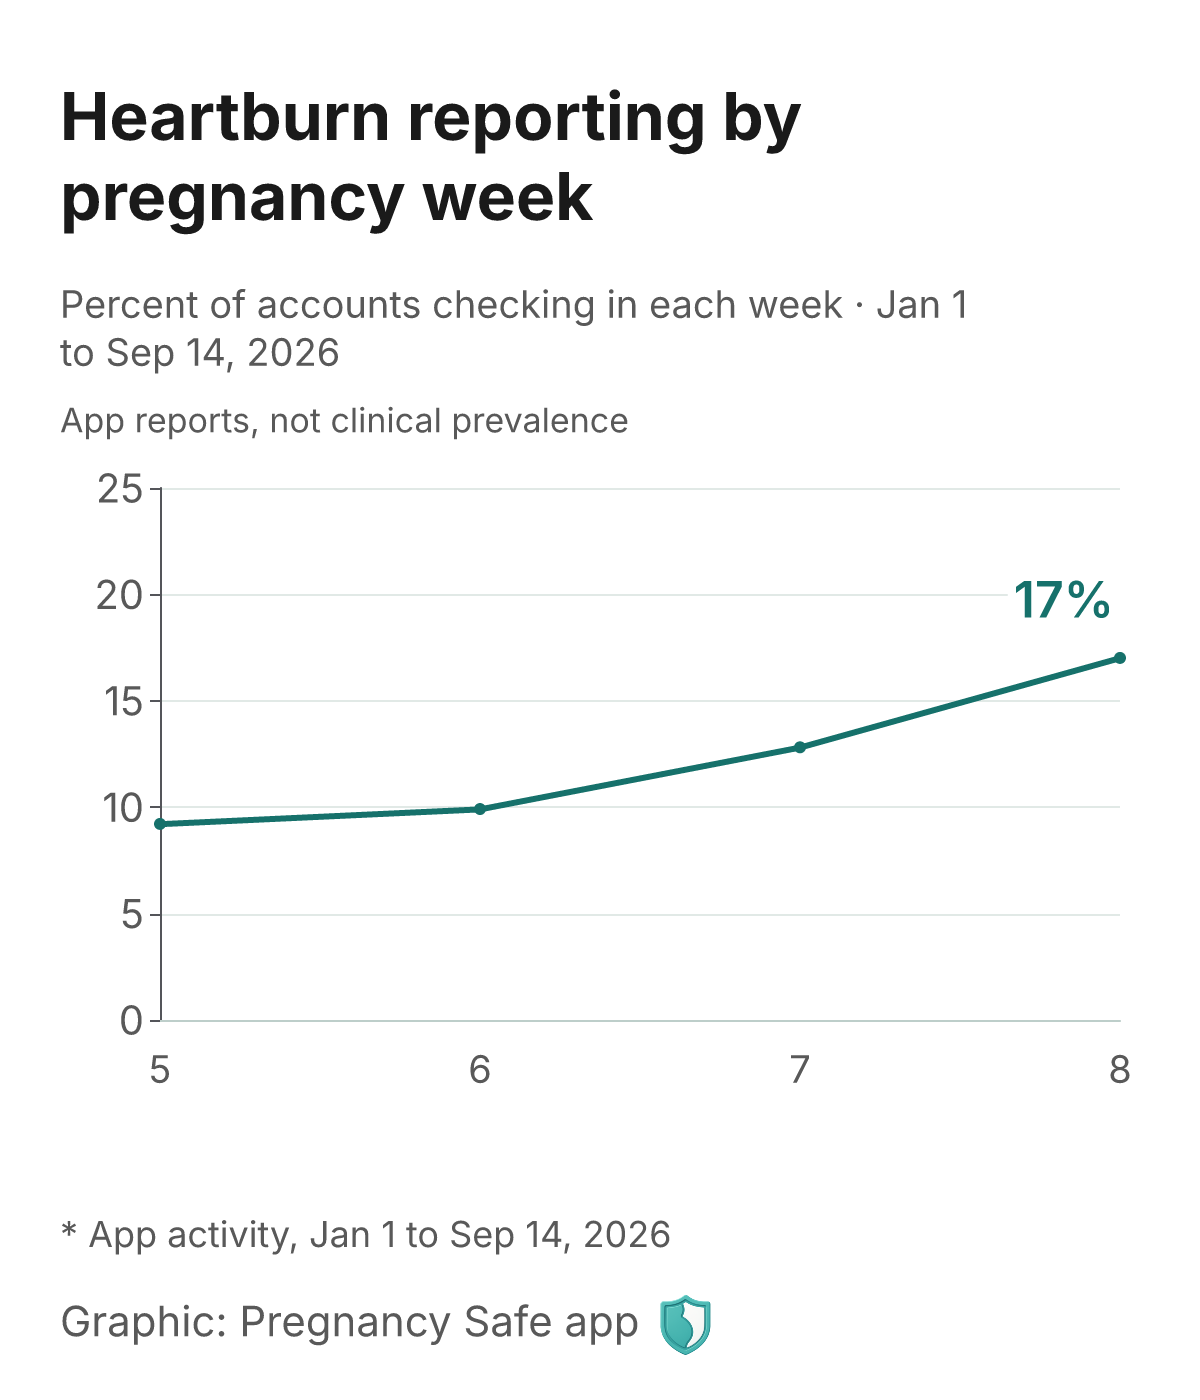
Among the displayed weeks in Pregnancy Safe, heartburn reporting was highest in assigned week 8: 17.0% of 235 accounts checking in that week. Data cover January 1, 2026 to September 14, 2026. Reporting means logging that response at least once in the week.
Download imageCan't sleep reporting by pregnancy week
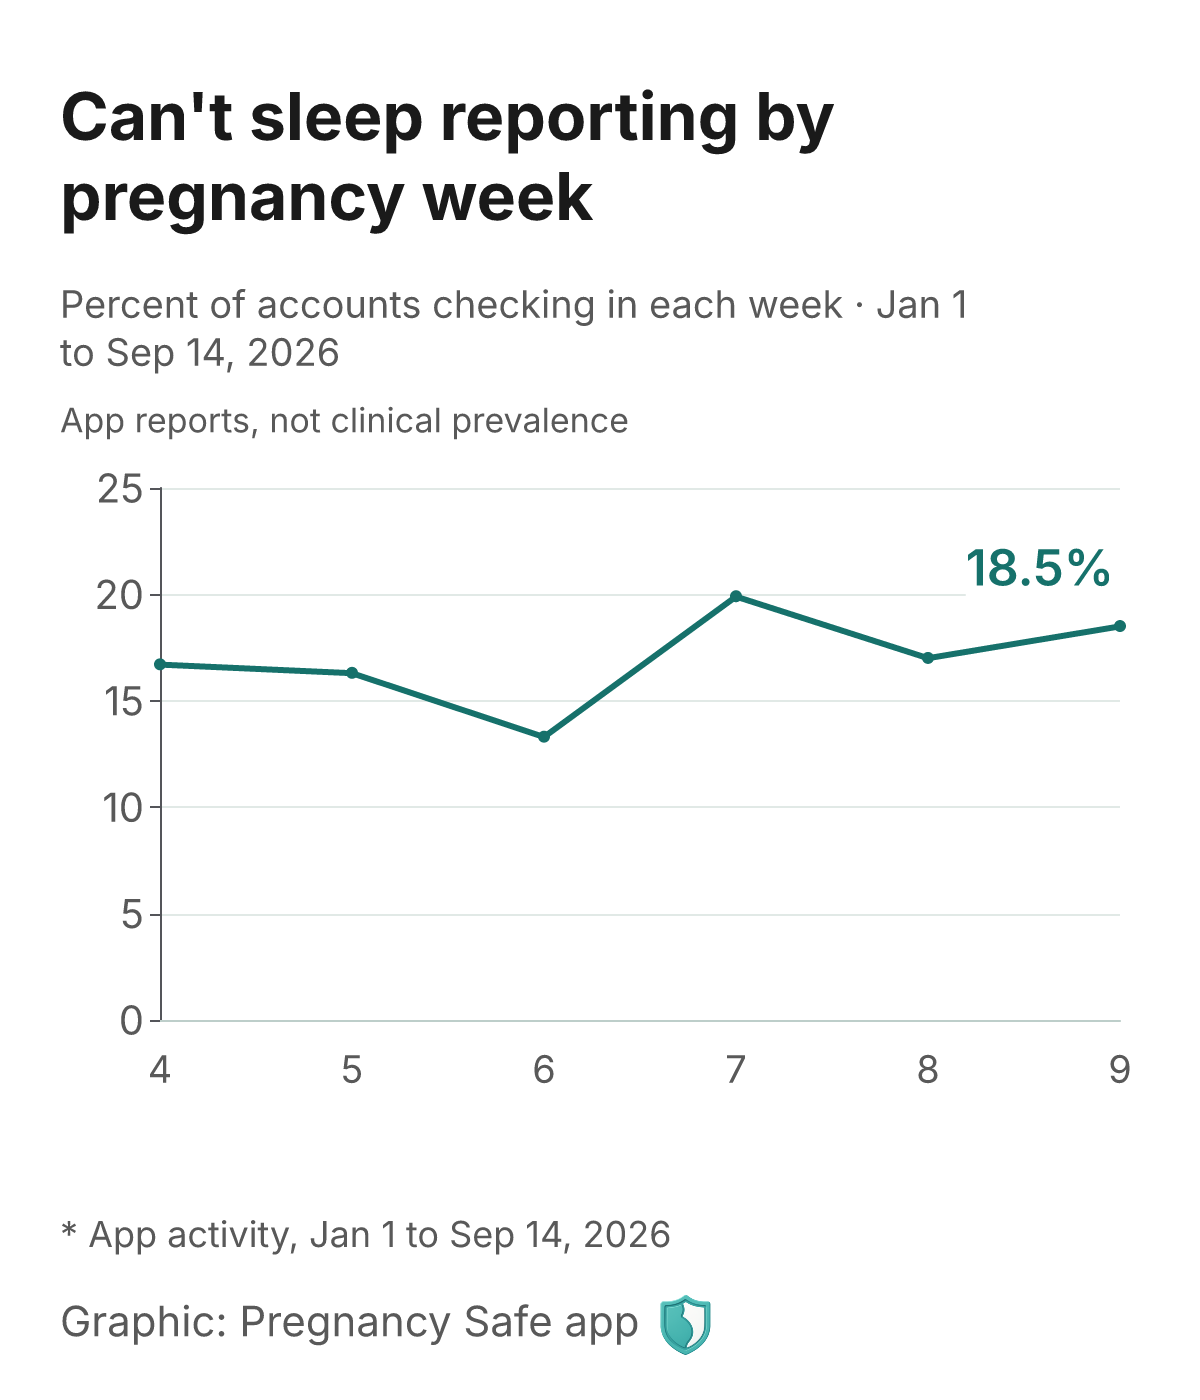
Among the displayed weeks in Pregnancy Safe, can't sleep reporting was highest in assigned week 7: 19.9% of 282 accounts checking in that week. Data cover January 1, 2026 to September 14, 2026. Reporting means logging that response at least once in the week.
Download imageMoods logged in the Pregnancy Safe app
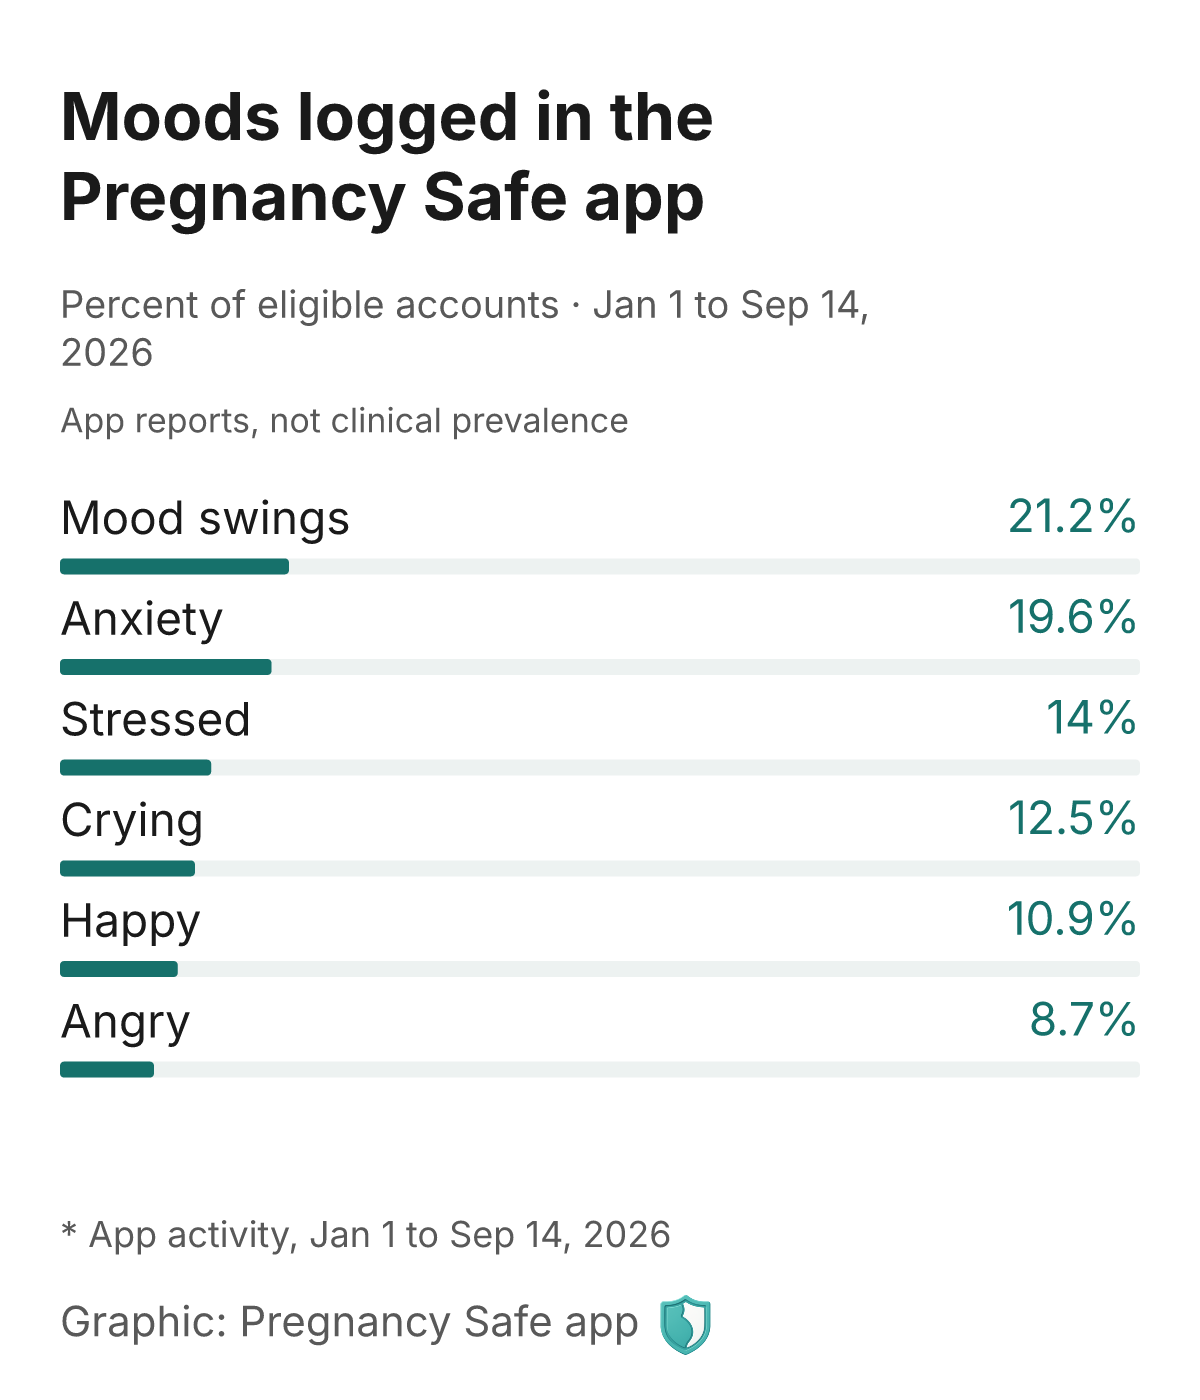
From January 1, 2026 to September 14, 2026, 21.2% of 2,368 eligible Pregnancy Safe accounts logged mood swings . These are account reporting shares, not population prevalence.
Download imageSymptoms logged together
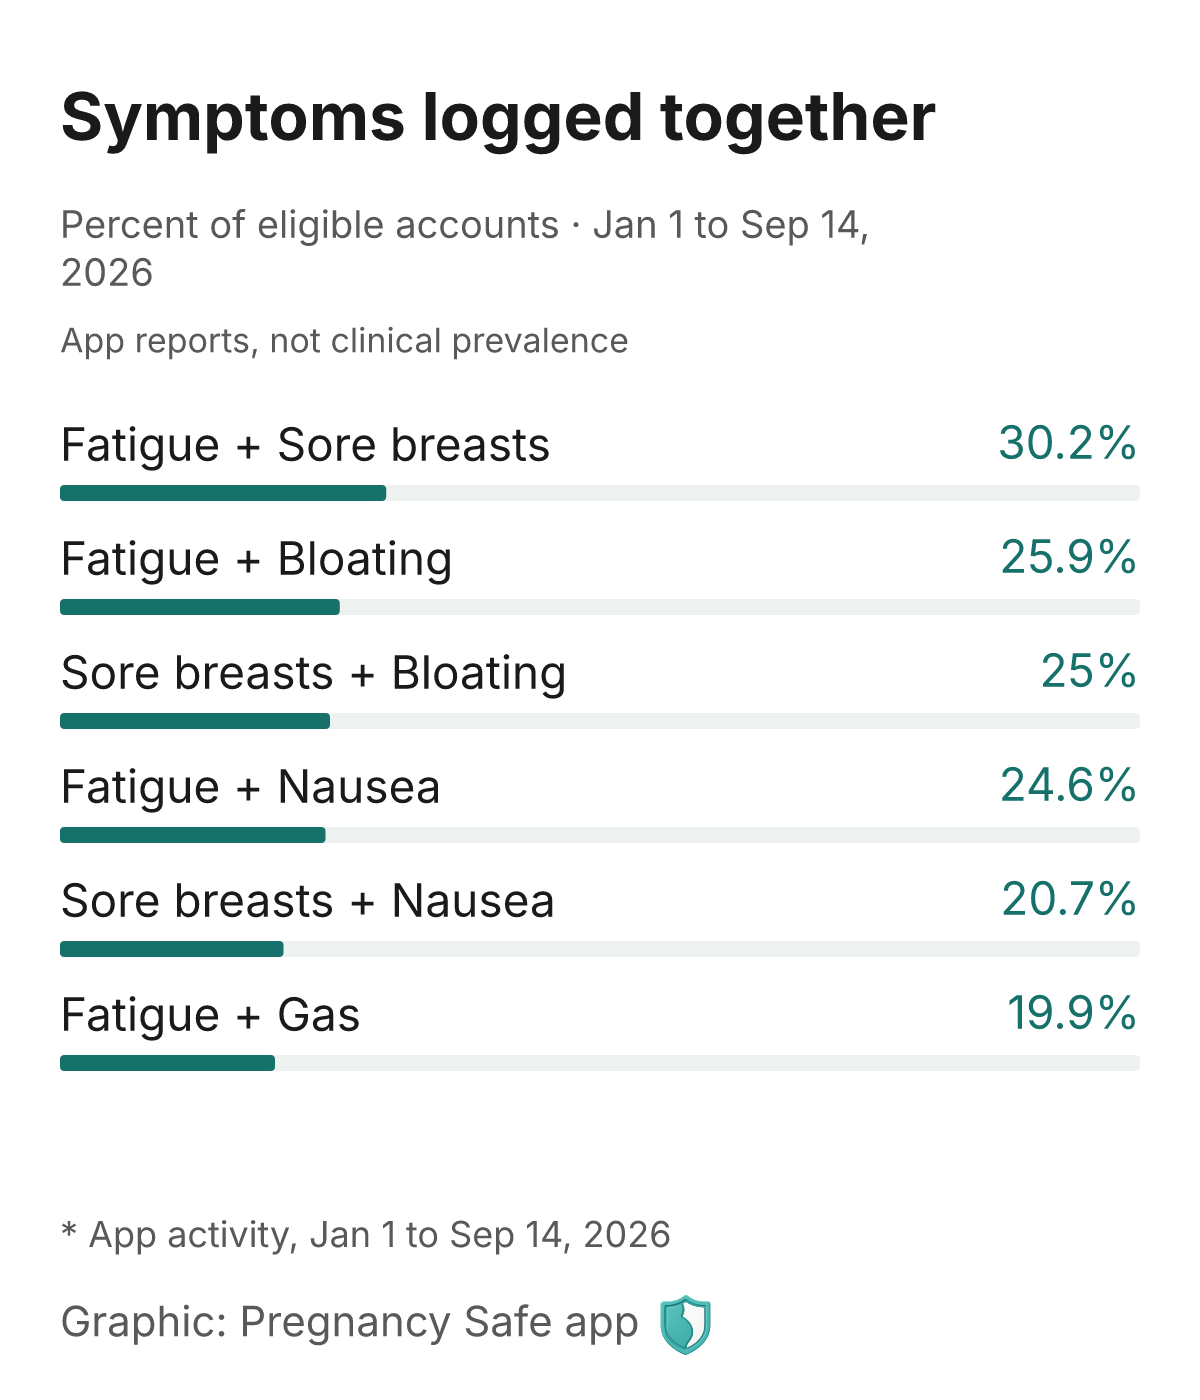
From January 1, 2026 to September 14, 2026, 30.2% of 2,368 eligible Pregnancy Safe accounts logged fatigue + sore breasts on the same check in. These are account reporting shares, not population prevalence.
Download imageNo symptoms today reporting by pregnancy week
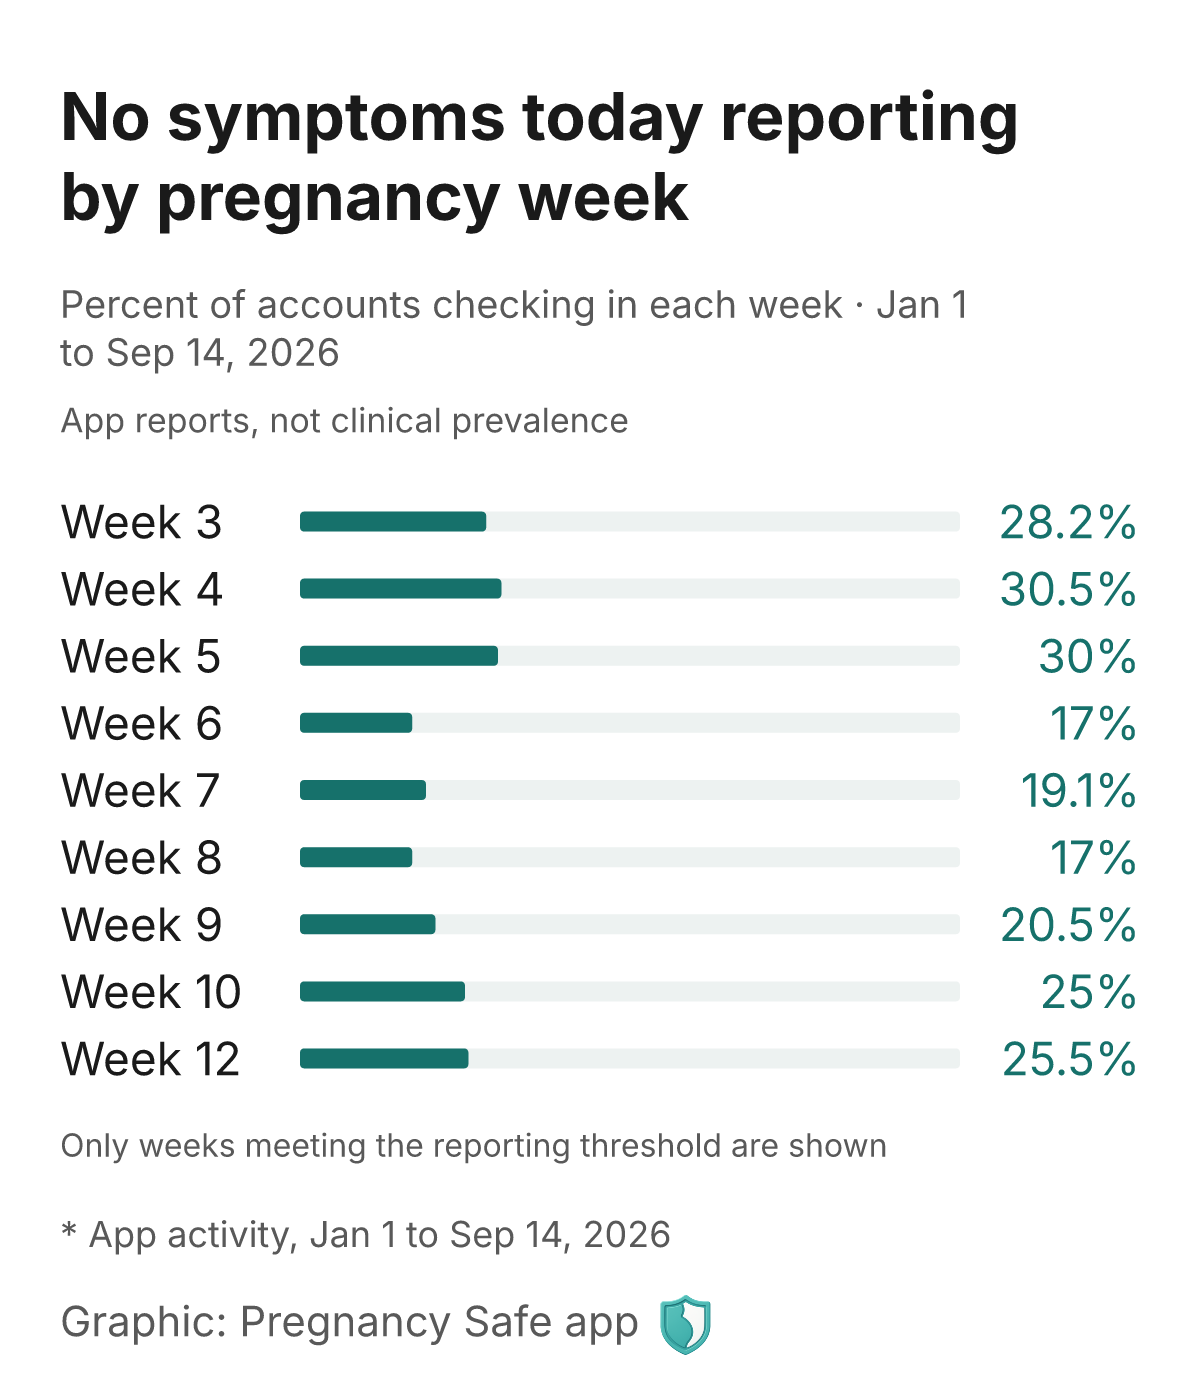
Among the displayed weeks in Pregnancy Safe, no symptoms today reporting was highest in assigned week 4: 30.5% of 426 accounts checking in that week. Data cover January 1, 2026 to September 14, 2026. Reporting means logging that response at least once in the week.
Download imageCravings reporting by pregnancy week
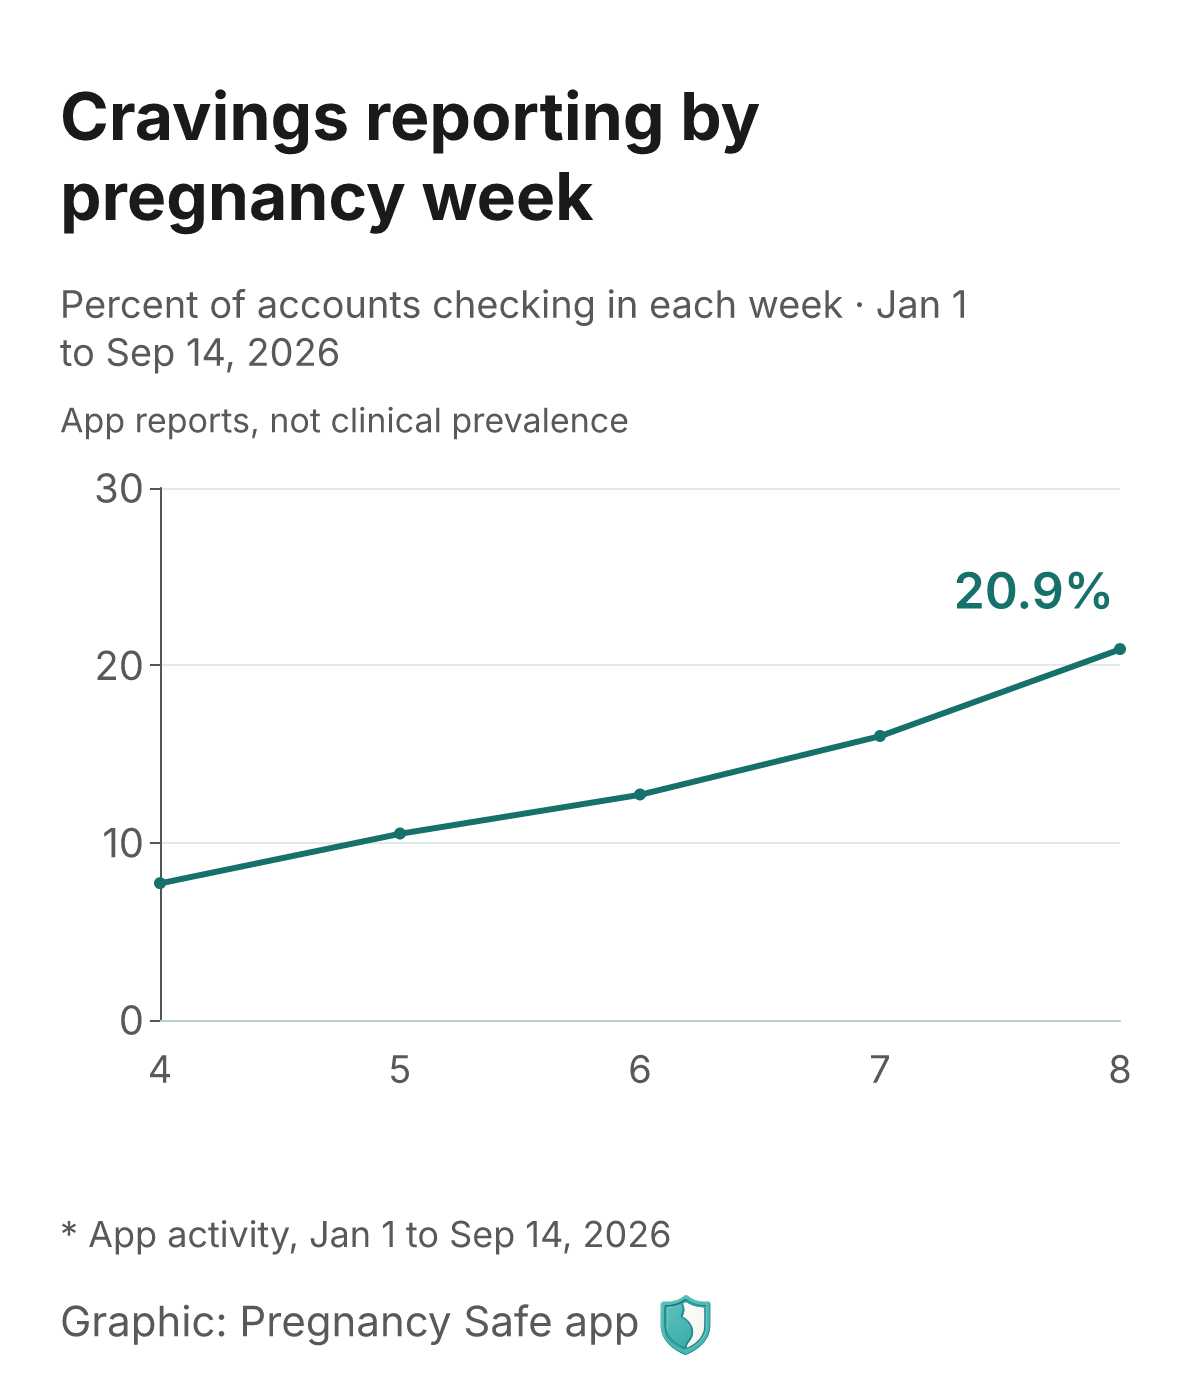
Among the displayed weeks in Pregnancy Safe, cravings reporting was highest in assigned week 8: 20.9% of 235 accounts checking in that week. Data cover January 1, 2026 to September 14, 2026. Reporting means logging that response at least once in the week.
Download imageConstipation reporting by pregnancy week
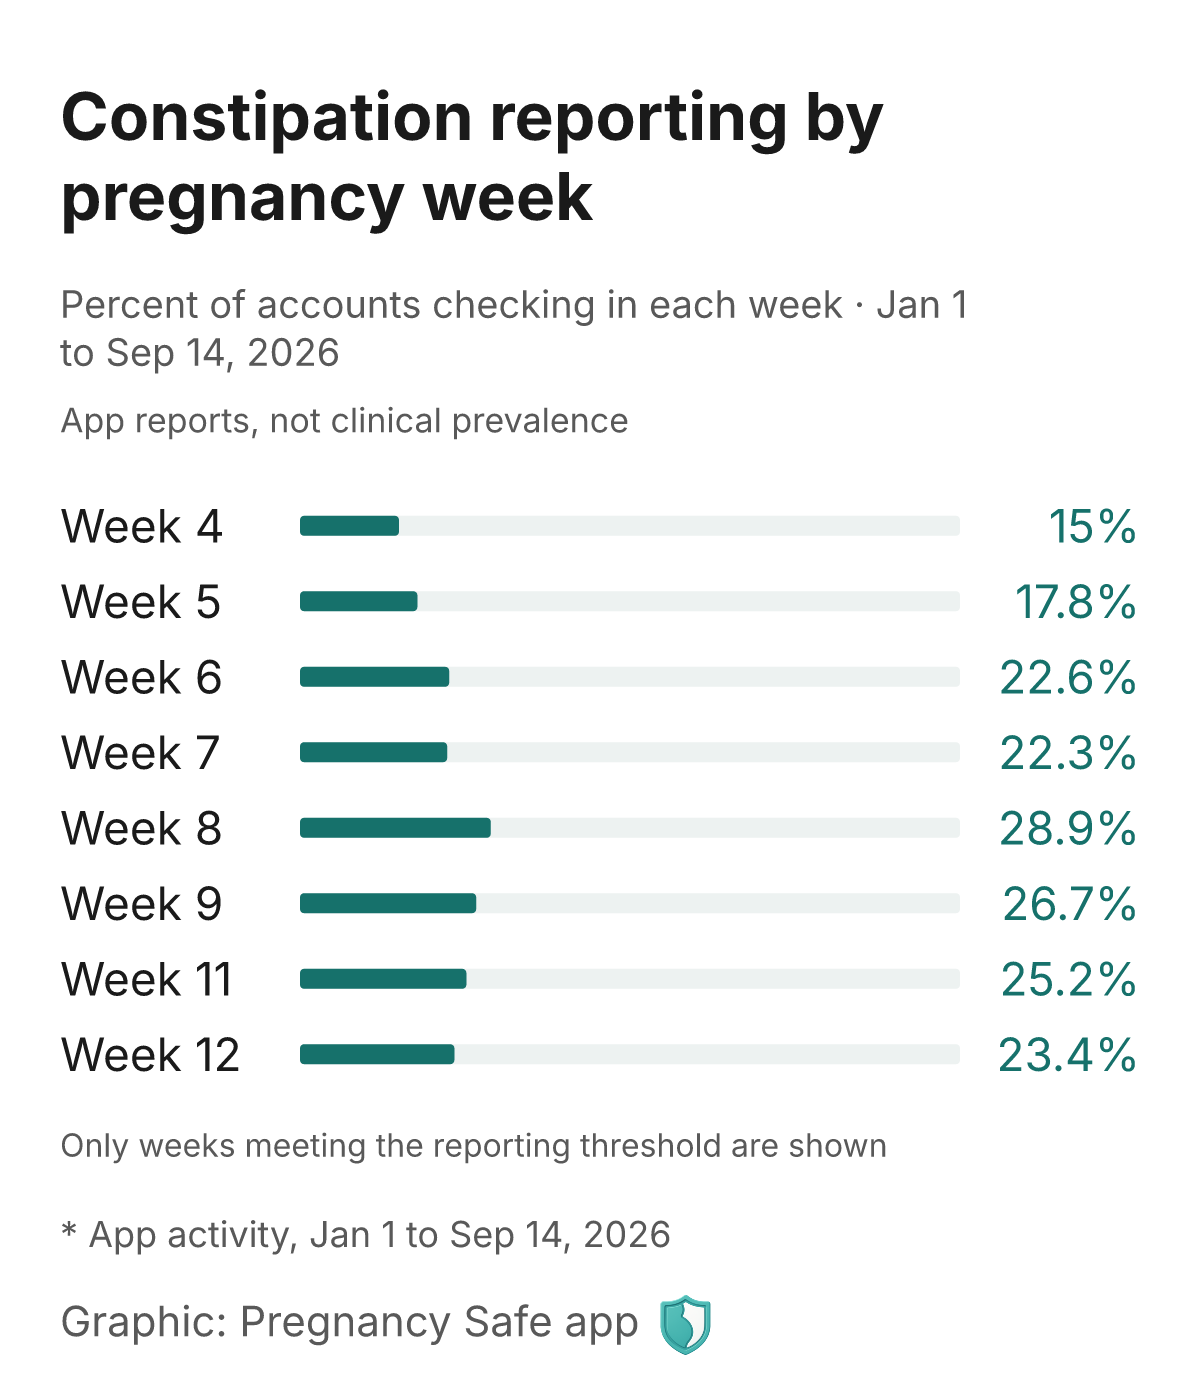
Among the displayed weeks in Pregnancy Safe, constipation reporting was highest in assigned week 8: 28.9% of 235 accounts checking in that week. Data cover January 1, 2026 to September 14, 2026. Reporting means logging that response at least once in the week.
Download imageSymptoms by pregnancy week
Symptoms logged in pregnancy week 3
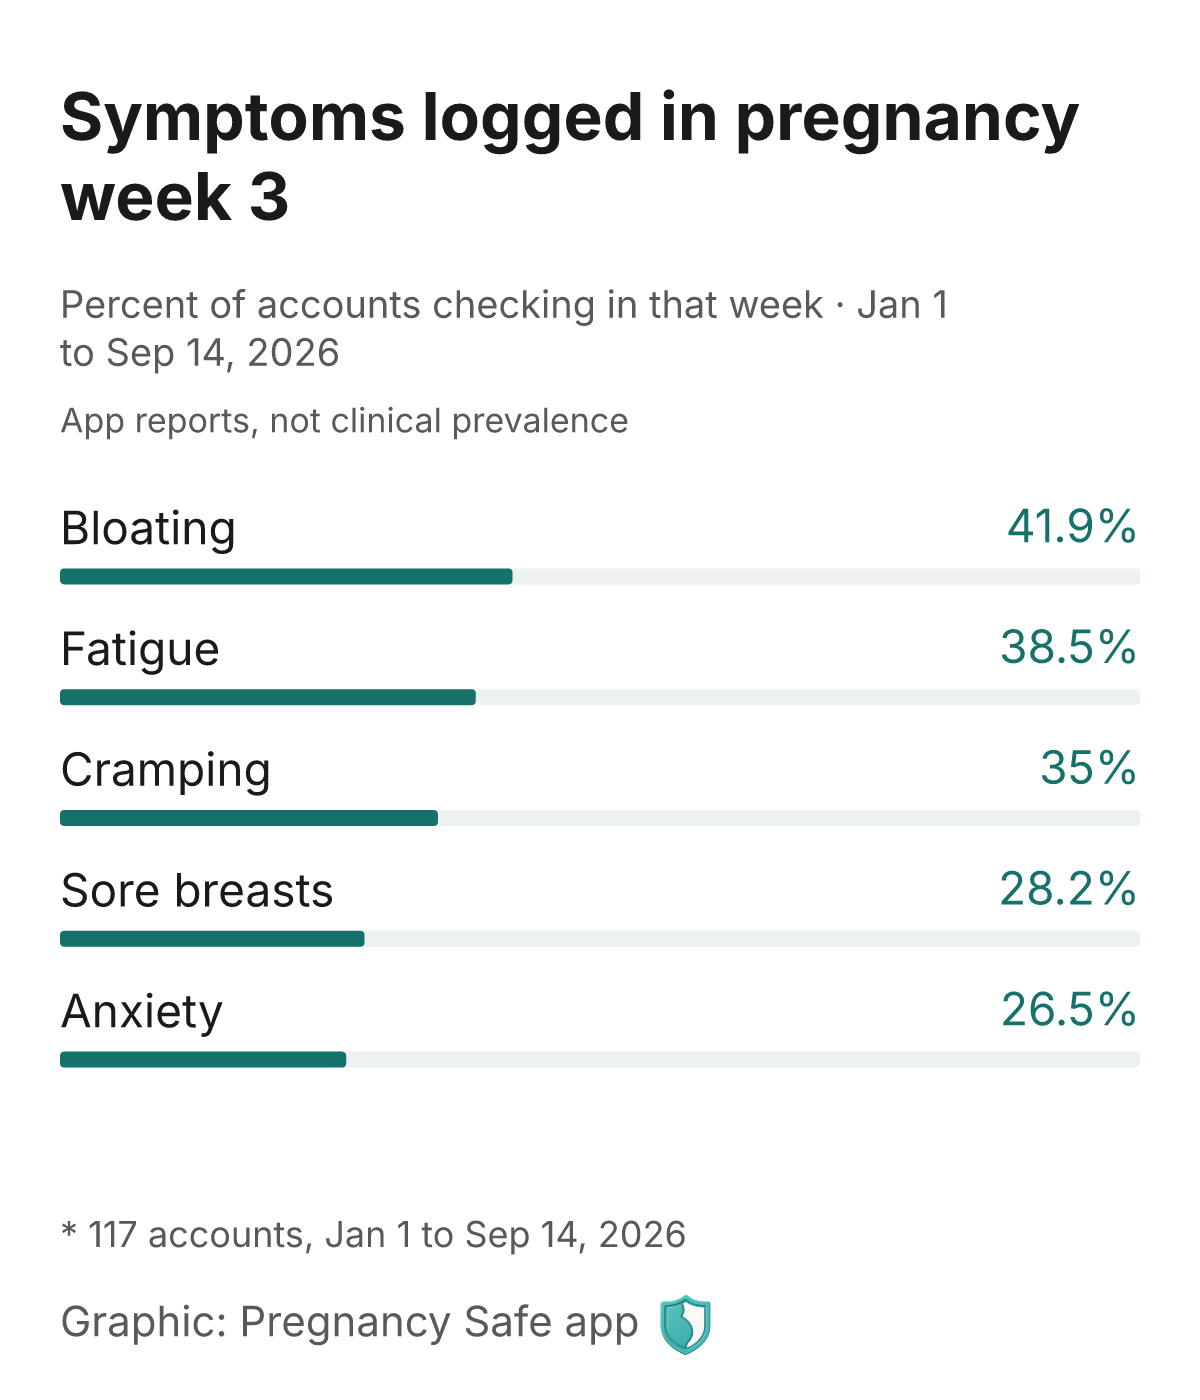
Among 117 Pregnancy Safe accounts with a check in assigned to pregnancy week 3, 41.9% logged bloating at least once during that week. The observation window was January 1, 2026 to September 14, 2026; this is app reporting, not clinical prevalence.
Download imageSymptoms logged in pregnancy week 4
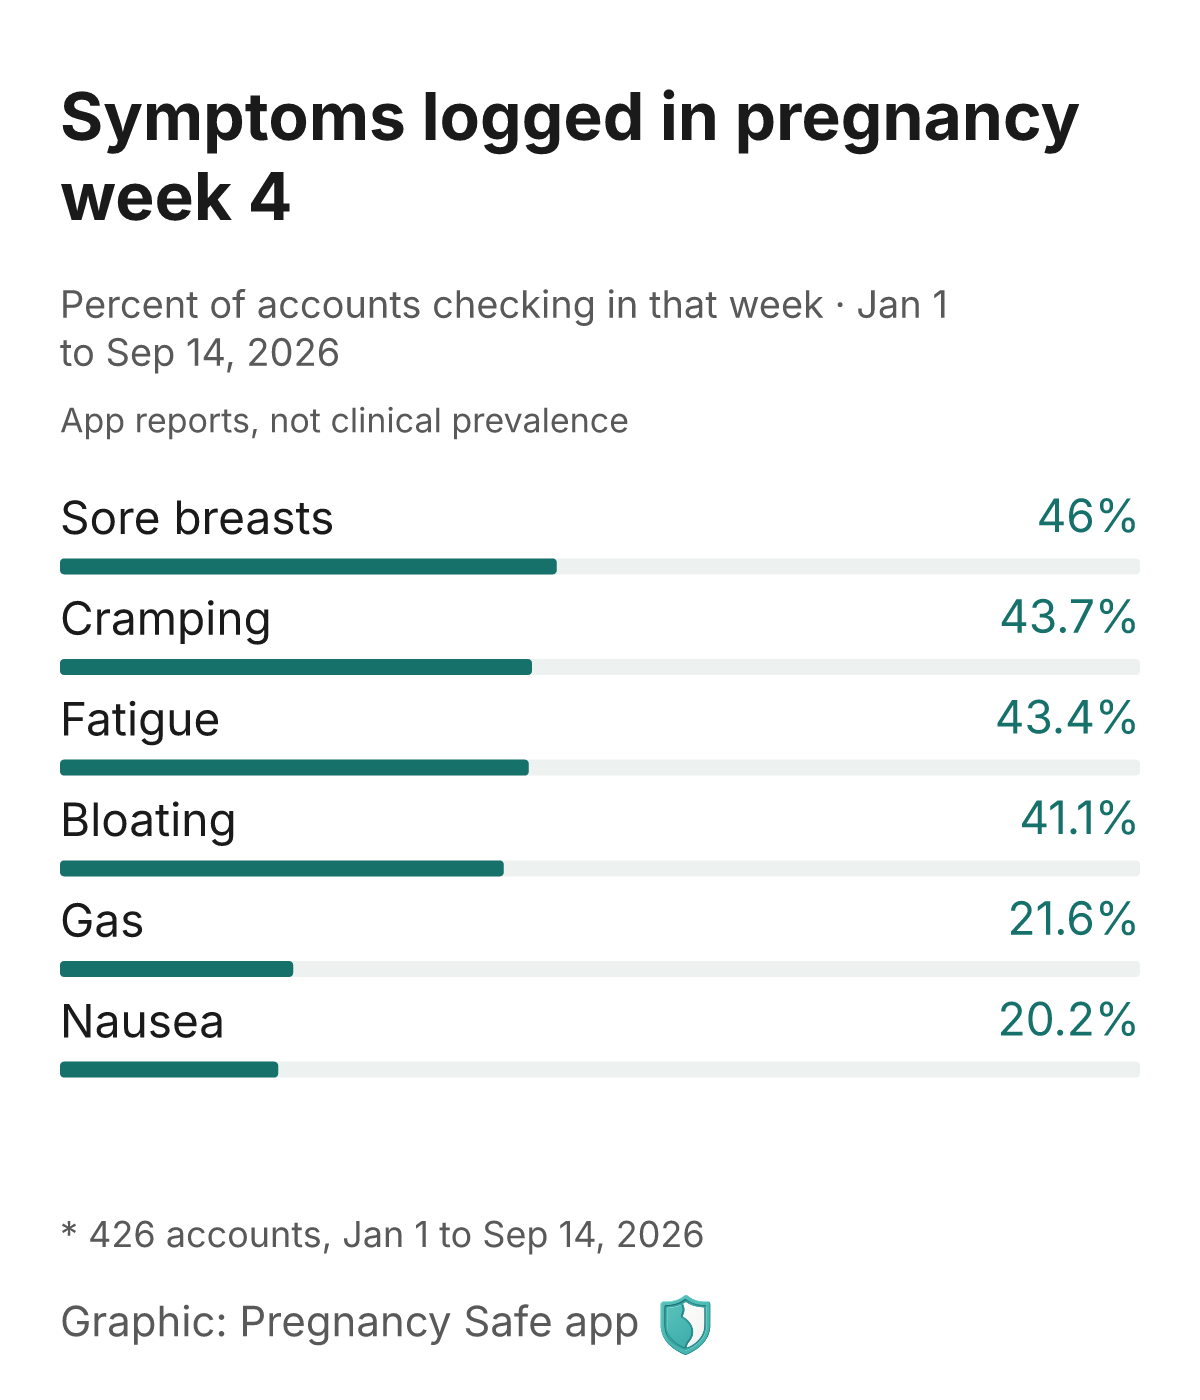
Among 426 Pregnancy Safe accounts with a check in assigned to pregnancy week 4, 46.0% logged sore breasts at least once during that week. The observation window was January 1, 2026 to September 14, 2026; this is app reporting, not clinical prevalence.
Download imageSymptoms logged in pregnancy week 5
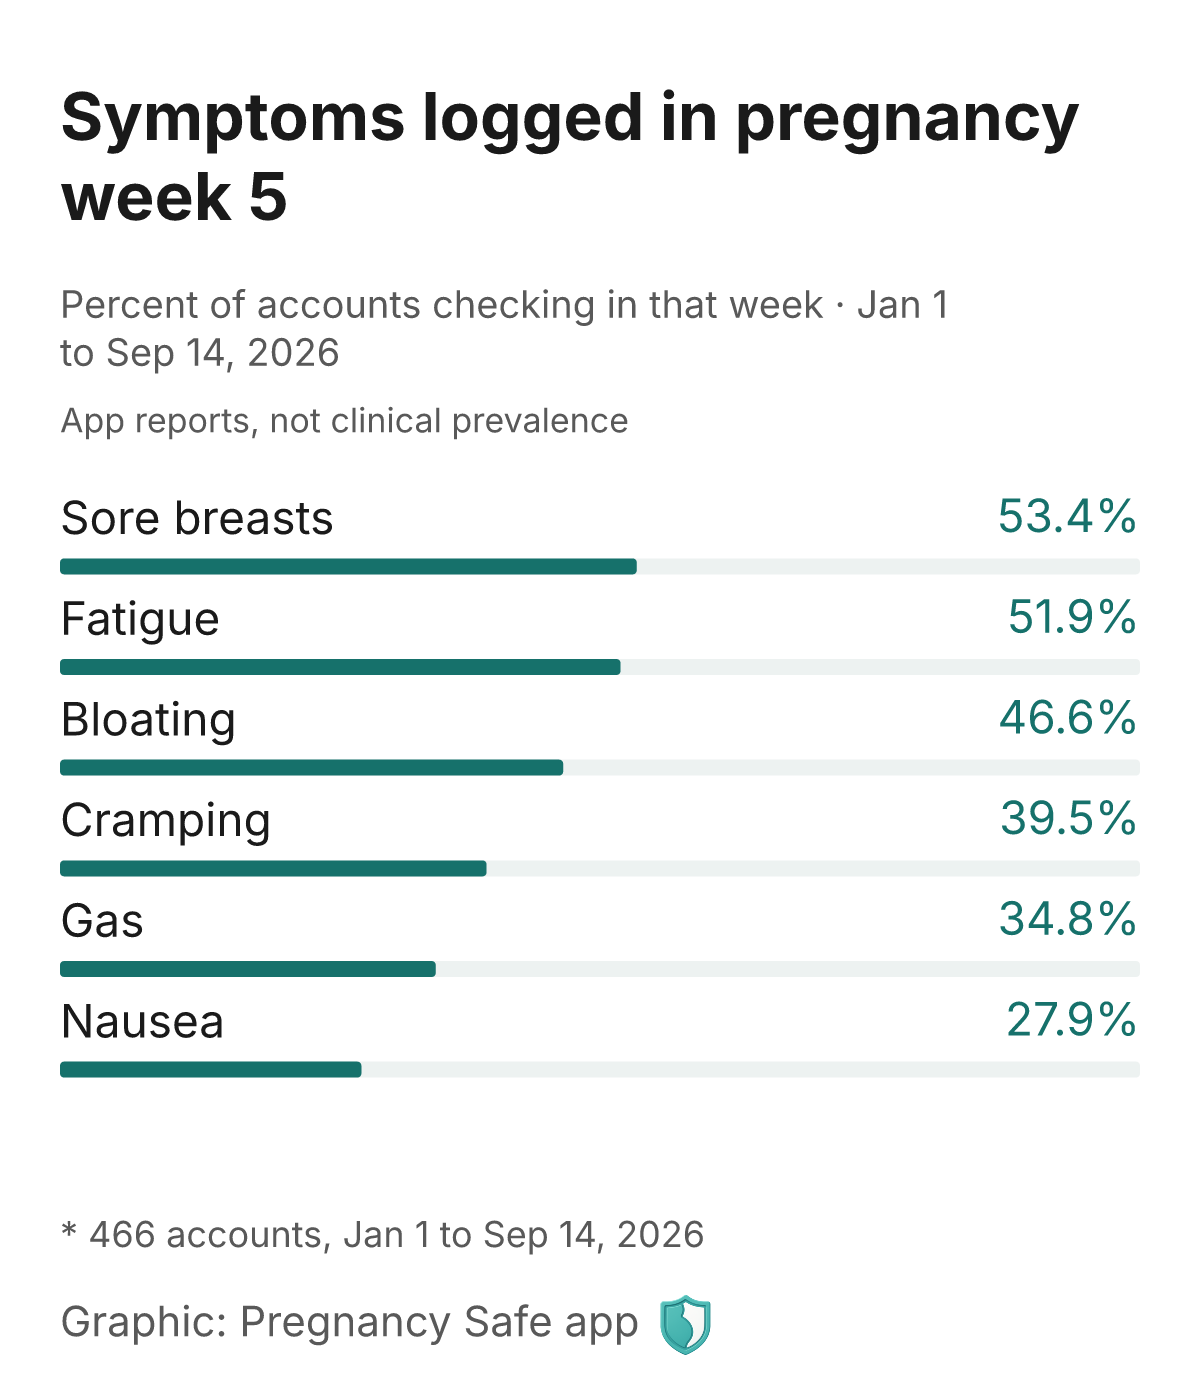
Among 466 Pregnancy Safe accounts with a check in assigned to pregnancy week 5, 53.4% logged sore breasts at least once during that week. The observation window was January 1, 2026 to September 14, 2026; this is app reporting, not clinical prevalence.
Download imageSymptoms logged in pregnancy week 6
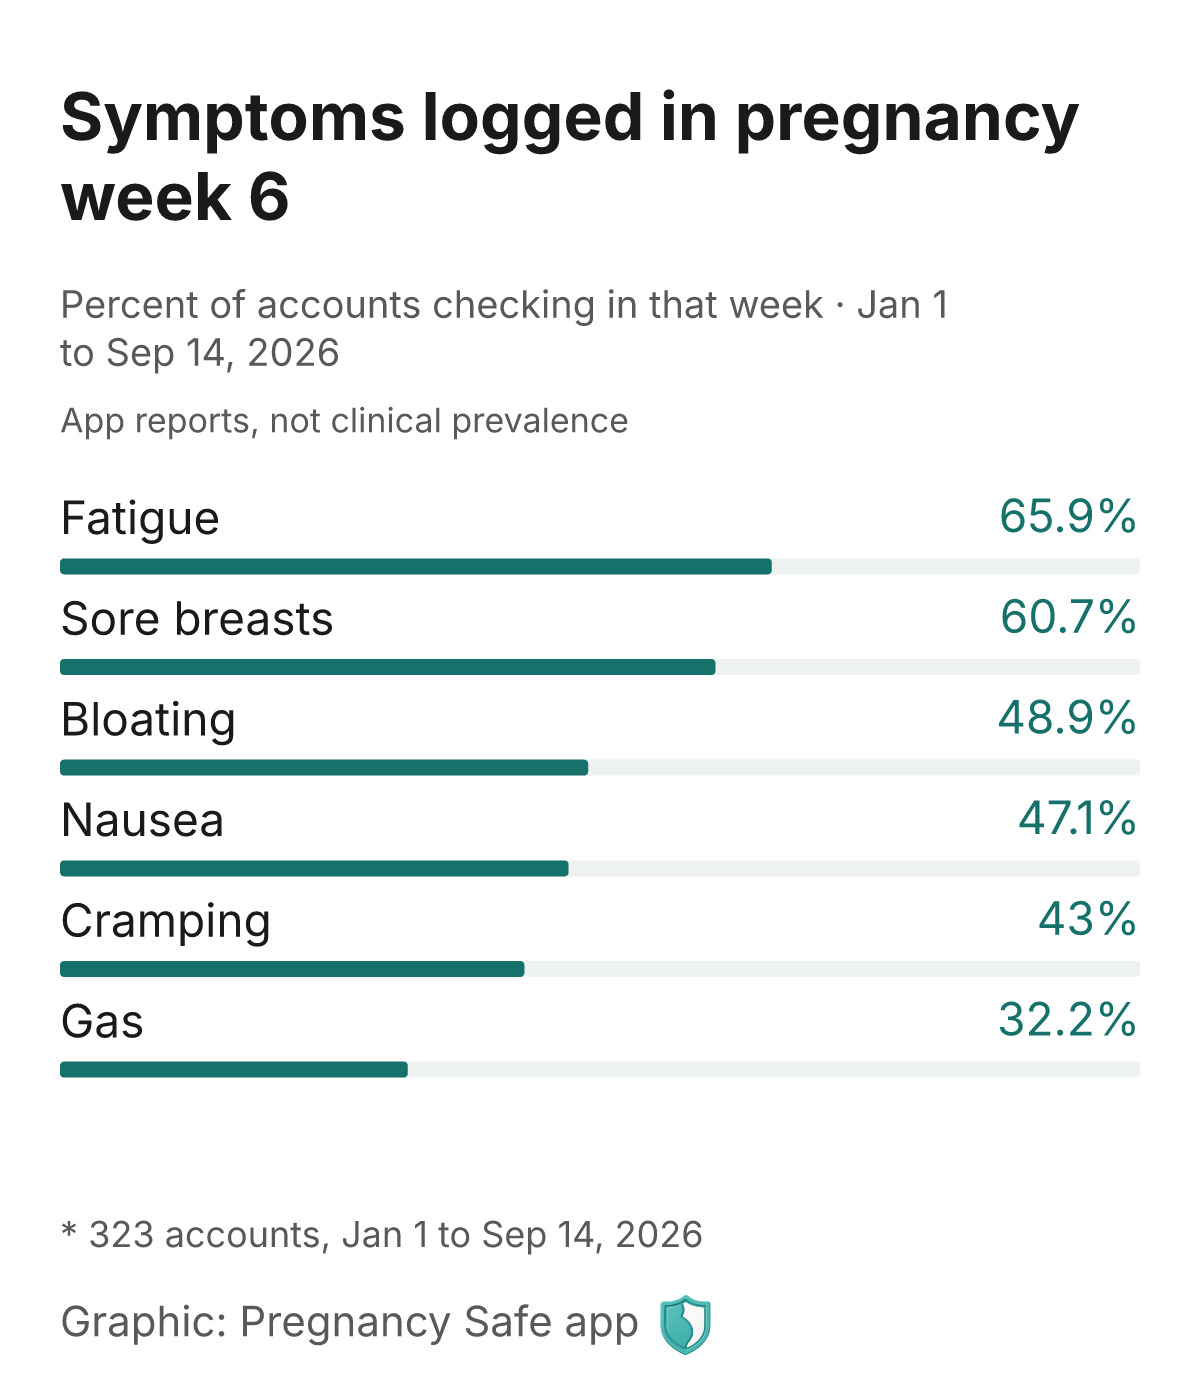
Among 323 Pregnancy Safe accounts with a check in assigned to pregnancy week 6, 65.9% logged fatigue at least once during that week. The observation window was January 1, 2026 to September 14, 2026; this is app reporting, not clinical prevalence.
Download imageSymptoms logged in pregnancy week 7
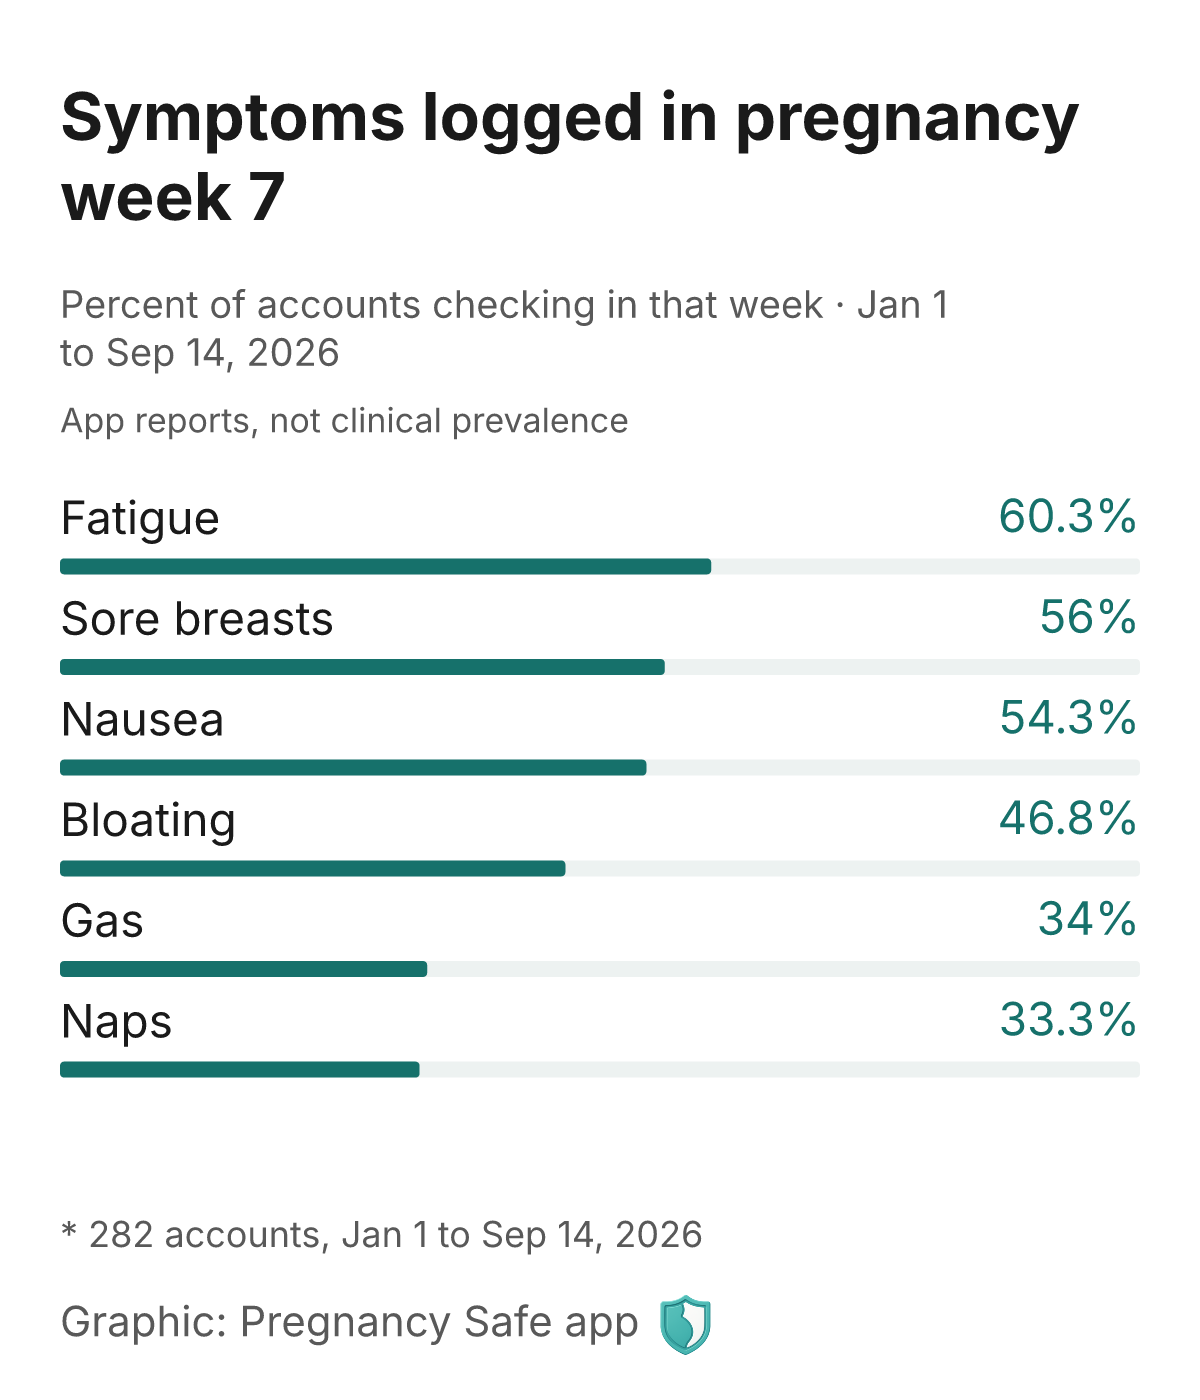
Among 282 Pregnancy Safe accounts with a check in assigned to pregnancy week 7, 60.3% logged fatigue at least once during that week. The observation window was January 1, 2026 to September 14, 2026; this is app reporting, not clinical prevalence.
Download imageSymptoms logged in pregnancy week 8
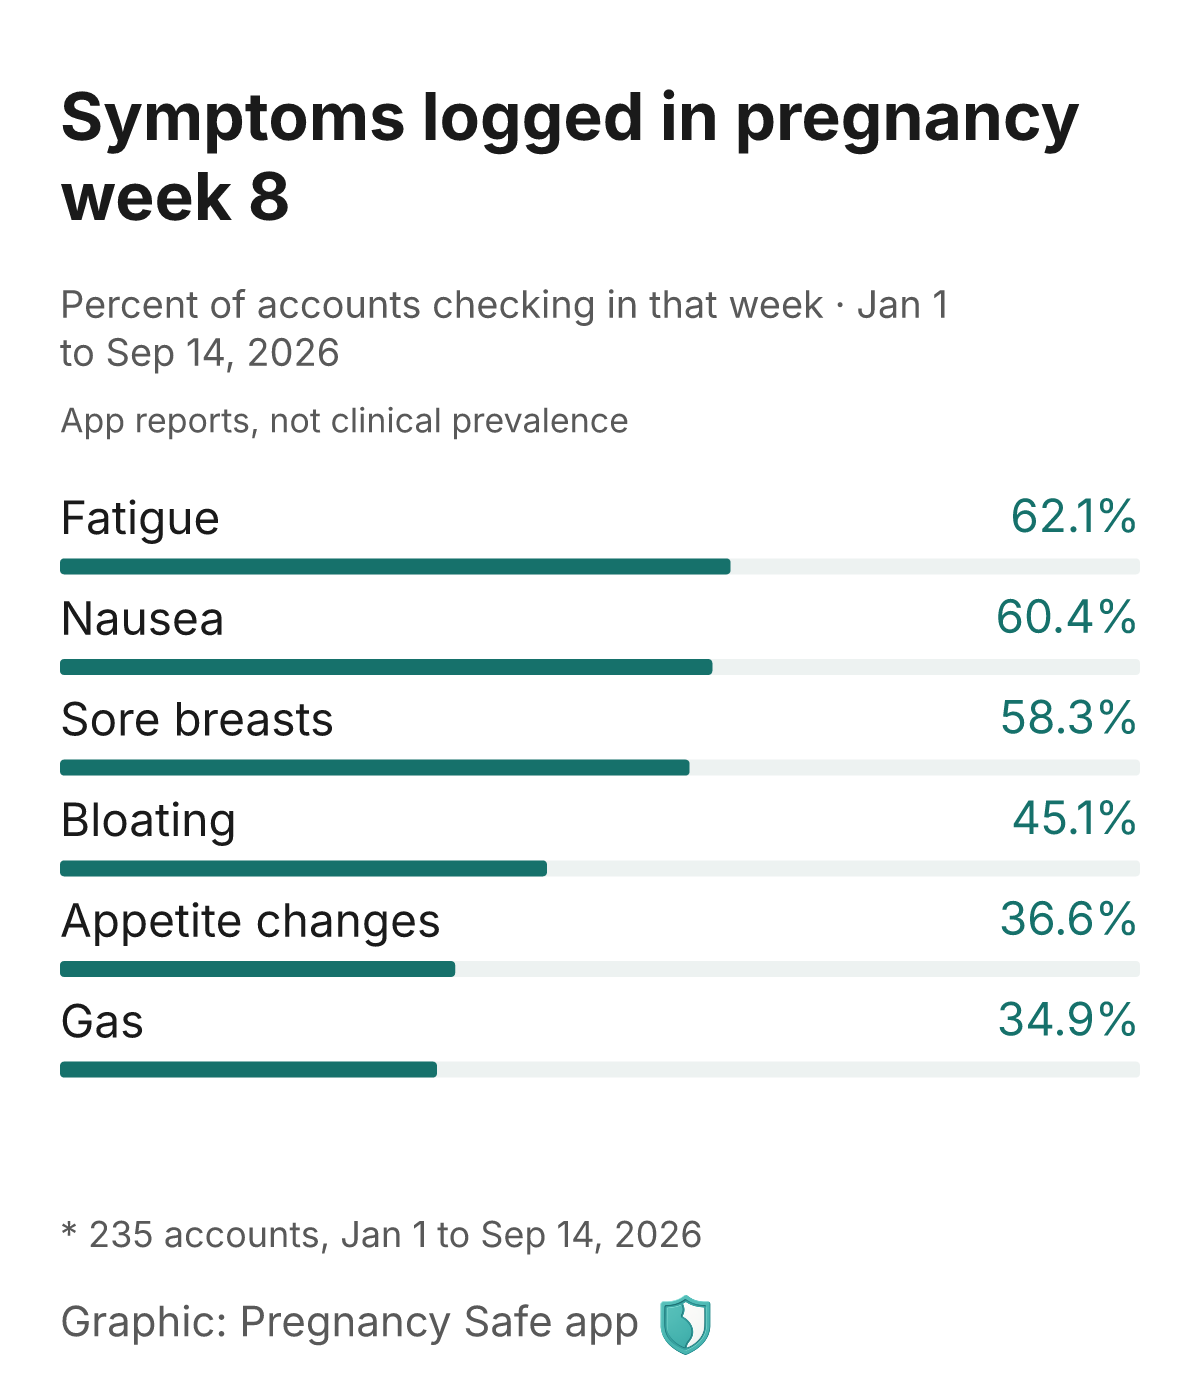
Among 235 Pregnancy Safe accounts with a check in assigned to pregnancy week 8, 62.1% logged fatigue at least once during that week. The observation window was January 1, 2026 to September 14, 2026; this is app reporting, not clinical prevalence.
Download imageSymptoms logged in pregnancy week 9
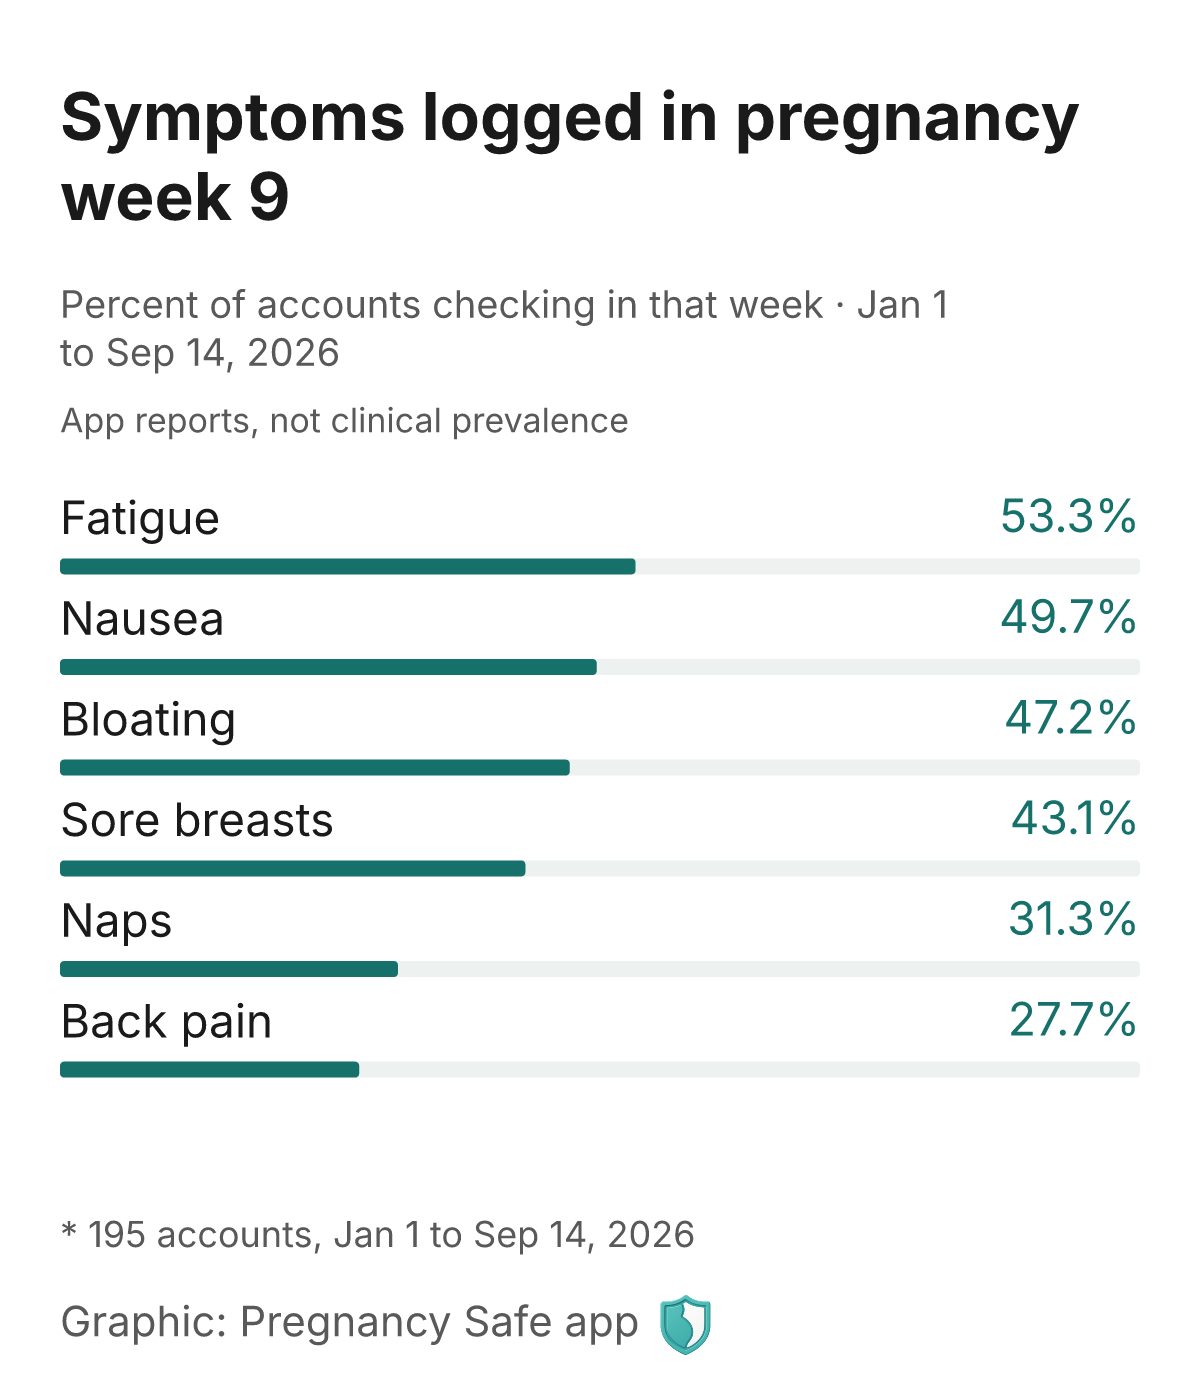
Among 195 Pregnancy Safe accounts with a check in assigned to pregnancy week 9, 53.3% logged fatigue at least once during that week. The observation window was January 1, 2026 to September 14, 2026; this is app reporting, not clinical prevalence.
Download imageSymptoms logged in pregnancy week 10
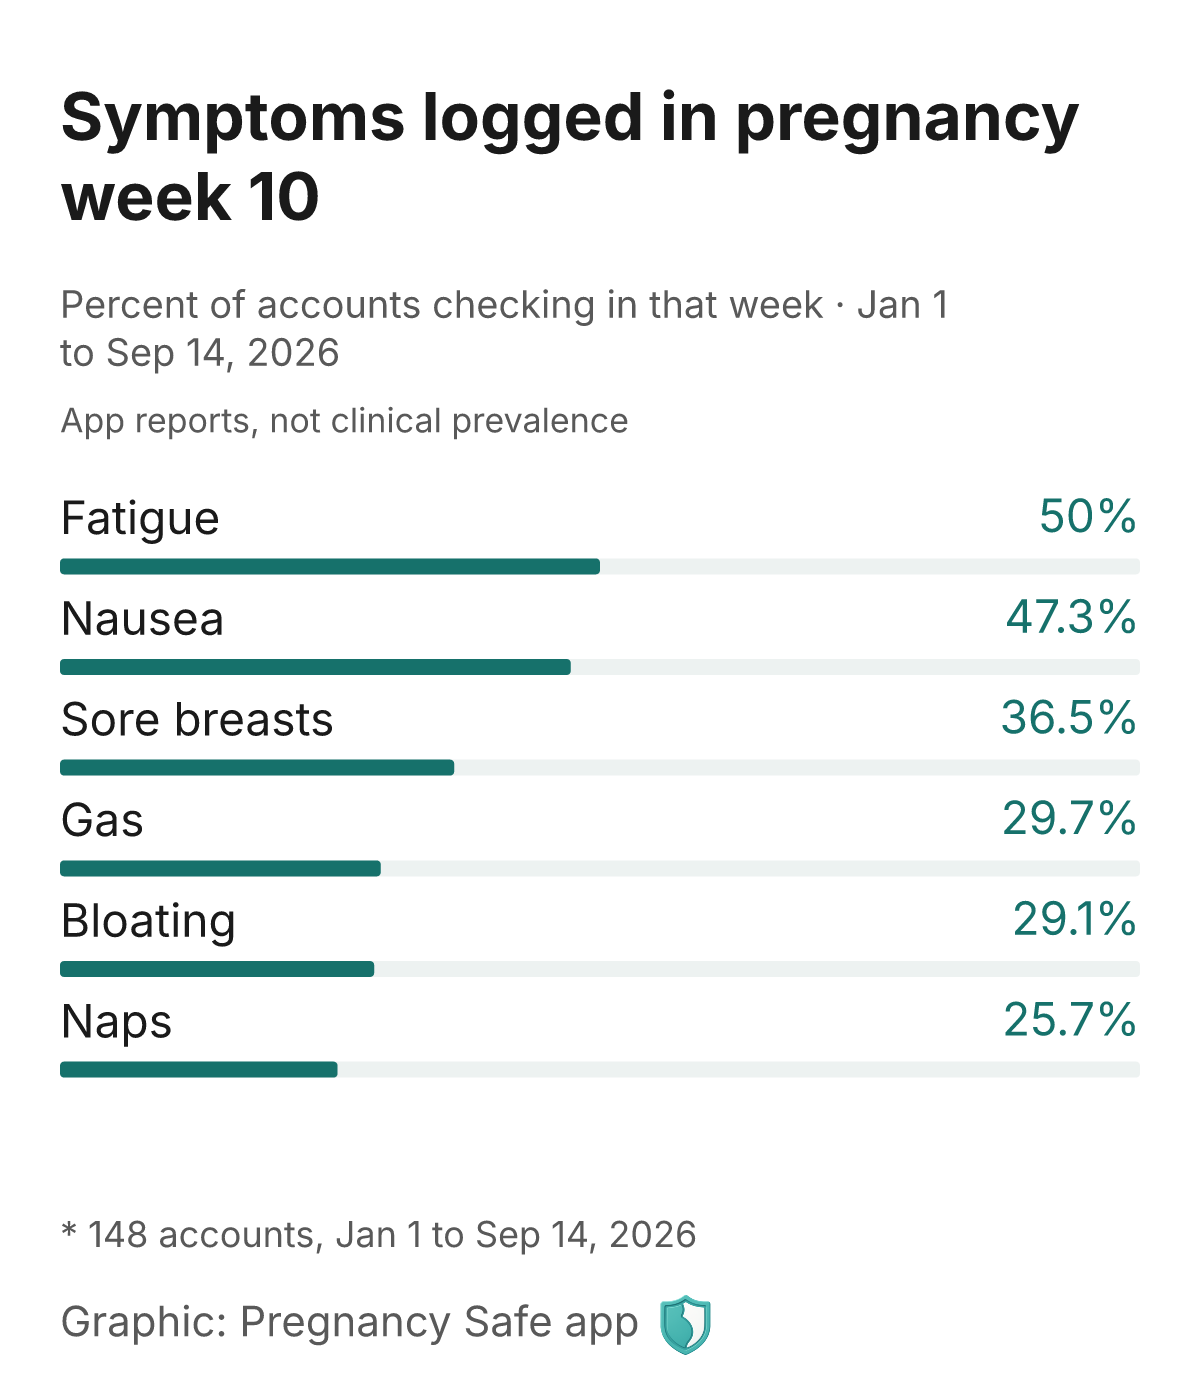
Among 148 Pregnancy Safe accounts with a check in assigned to pregnancy week 10, 50.0% logged fatigue at least once during that week. The observation window was January 1, 2026 to September 14, 2026; this is app reporting, not clinical prevalence.
Download imageSymptoms logged in pregnancy week 11
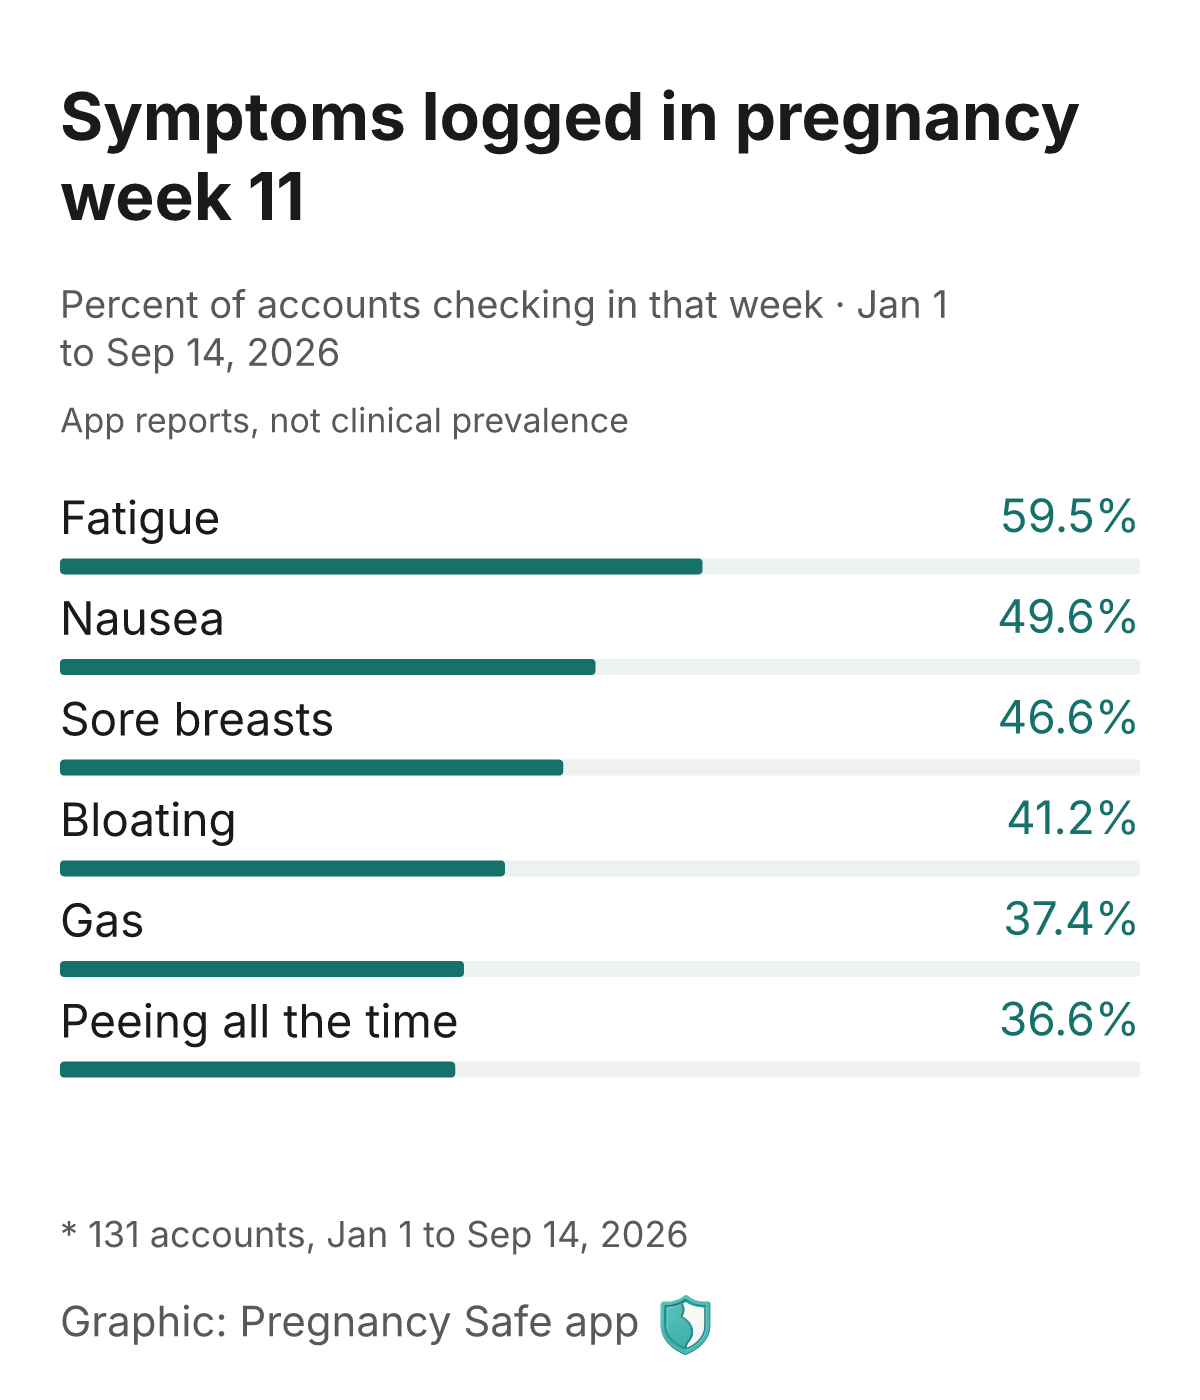
Among 131 Pregnancy Safe accounts with a check in assigned to pregnancy week 11, 59.5% logged fatigue at least once during that week. The observation window was January 1, 2026 to September 14, 2026; this is app reporting, not clinical prevalence.
Download imageSymptoms logged in pregnancy week 12
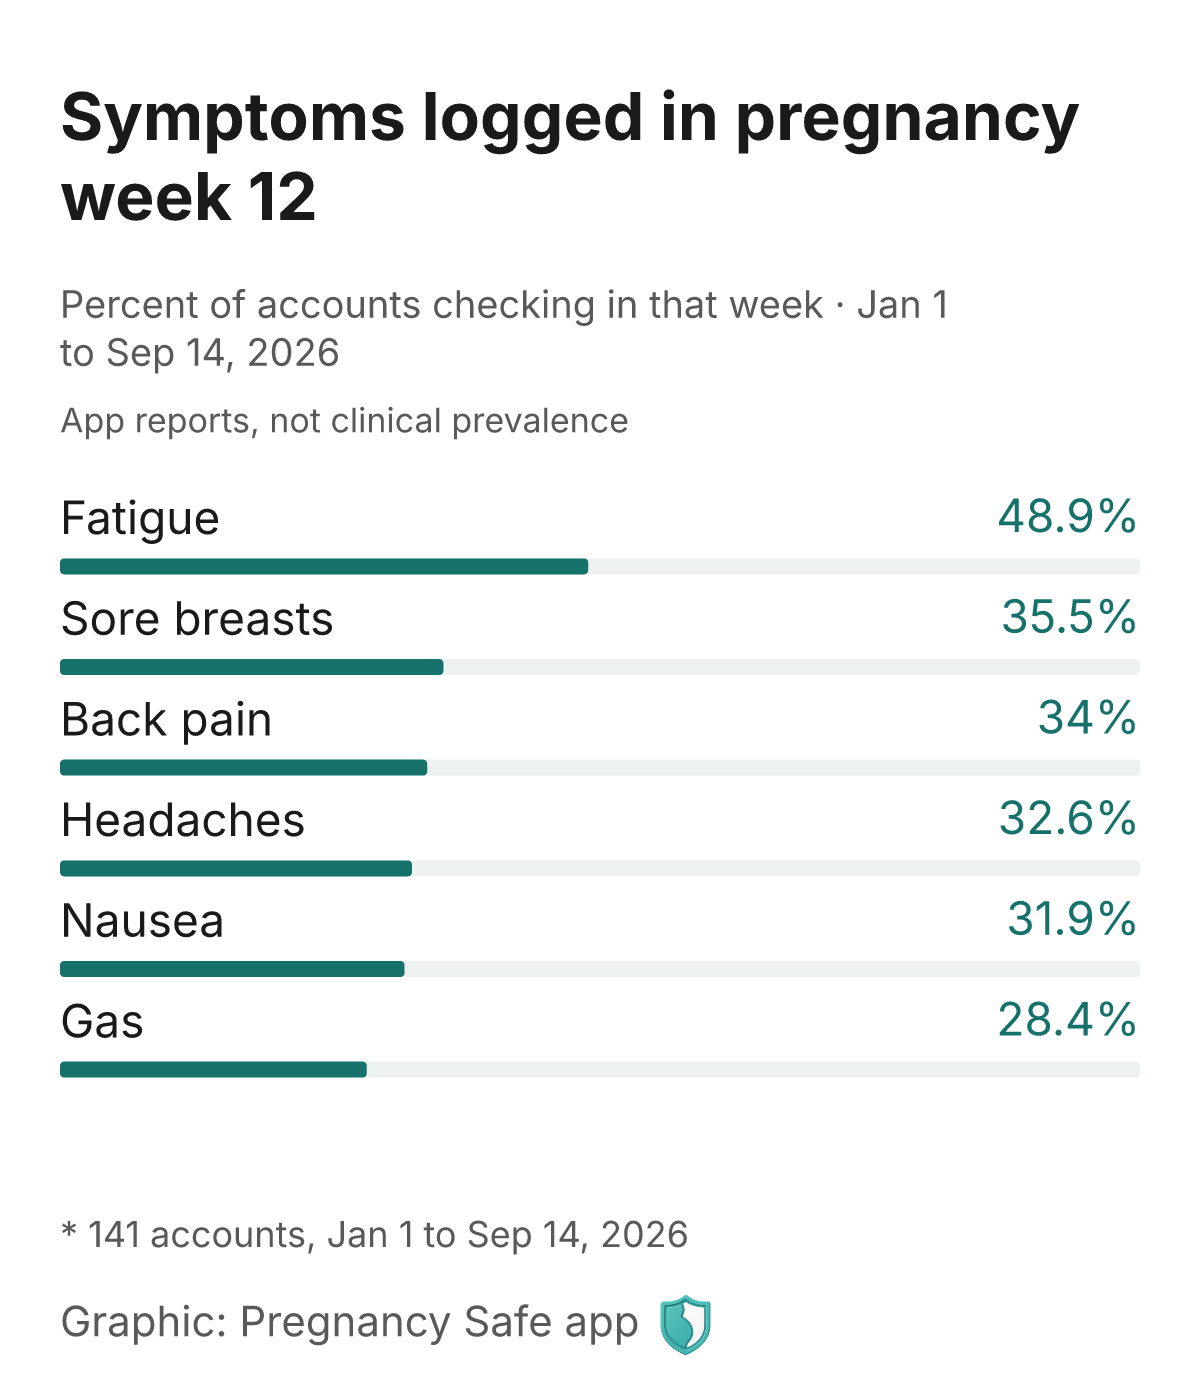
Among 141 Pregnancy Safe accounts with a check in assigned to pregnancy week 12, 48.9% logged fatigue at least once during that week. The observation window was January 1, 2026 to September 14, 2026; this is app reporting, not clinical prevalence.
Download imageIngredient flags by category
Ingredients flagged in sodas and soft drinks by Pregnancy Safe
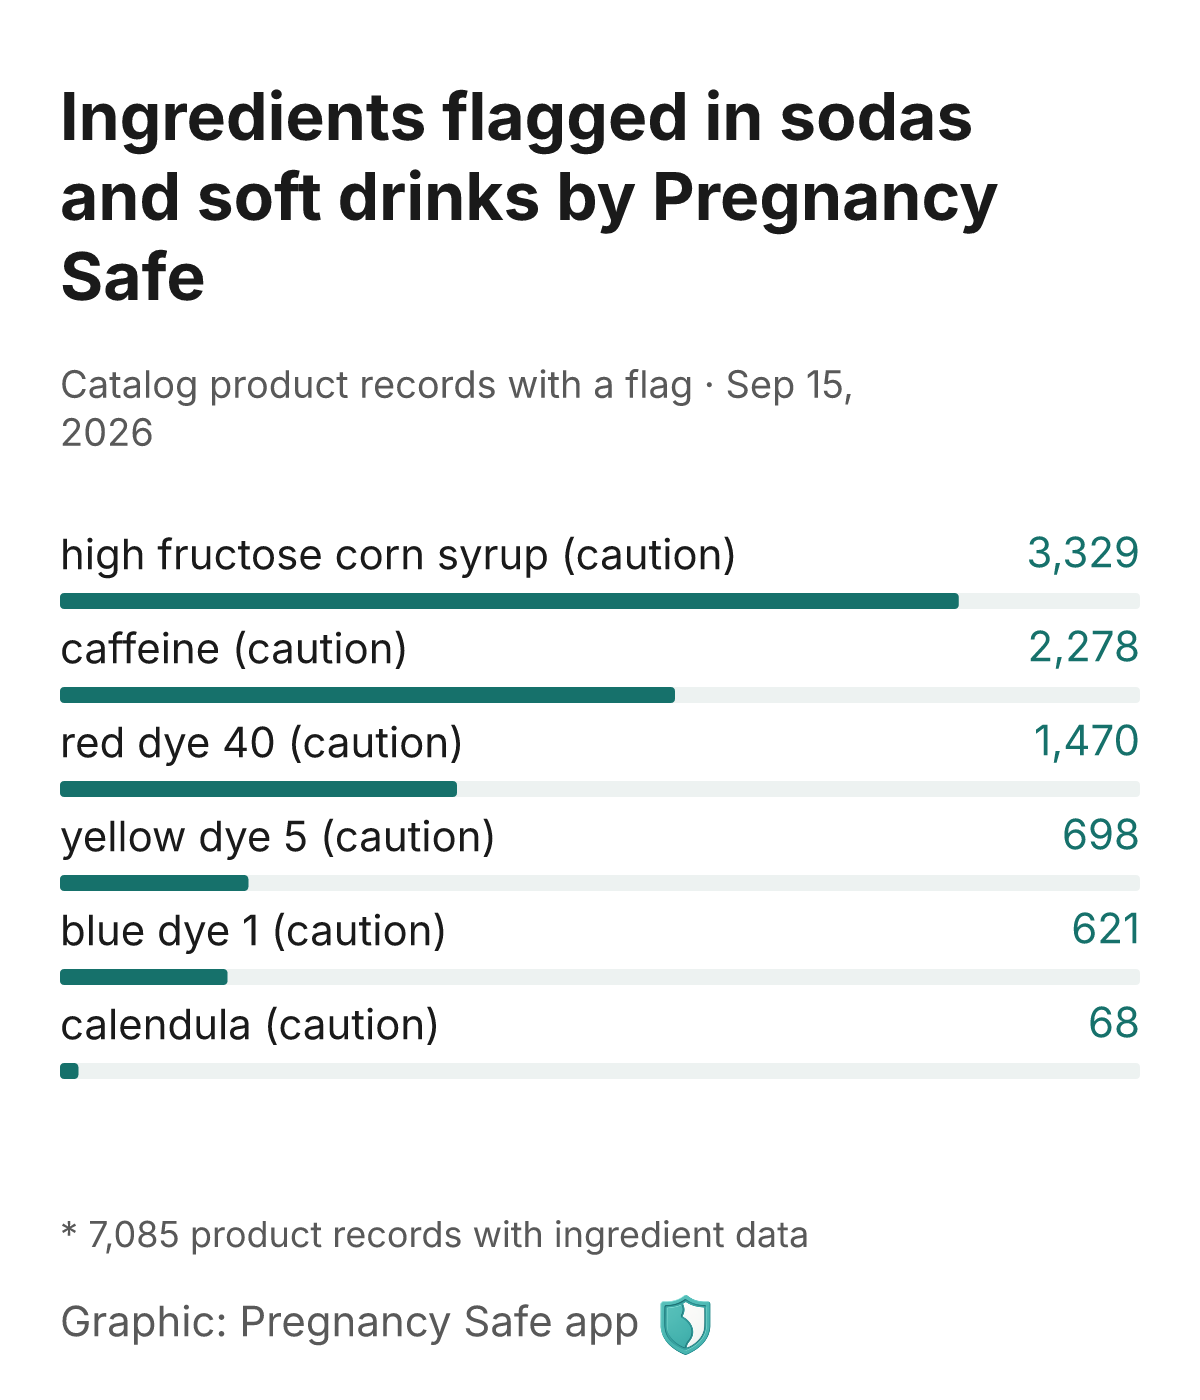
In Pregnancy Safe's catalog snapshot dated Sep 15, 2026, high fructose corn syrup (caution) was flagged in 3,329 of 7,085 soda soft drink catalog product records with ingredient data. Flags reflect the app's context specific rules, not observed pregnancy outcomes.
Download imageIngredients flagged in energy drinks by Pregnancy Safe
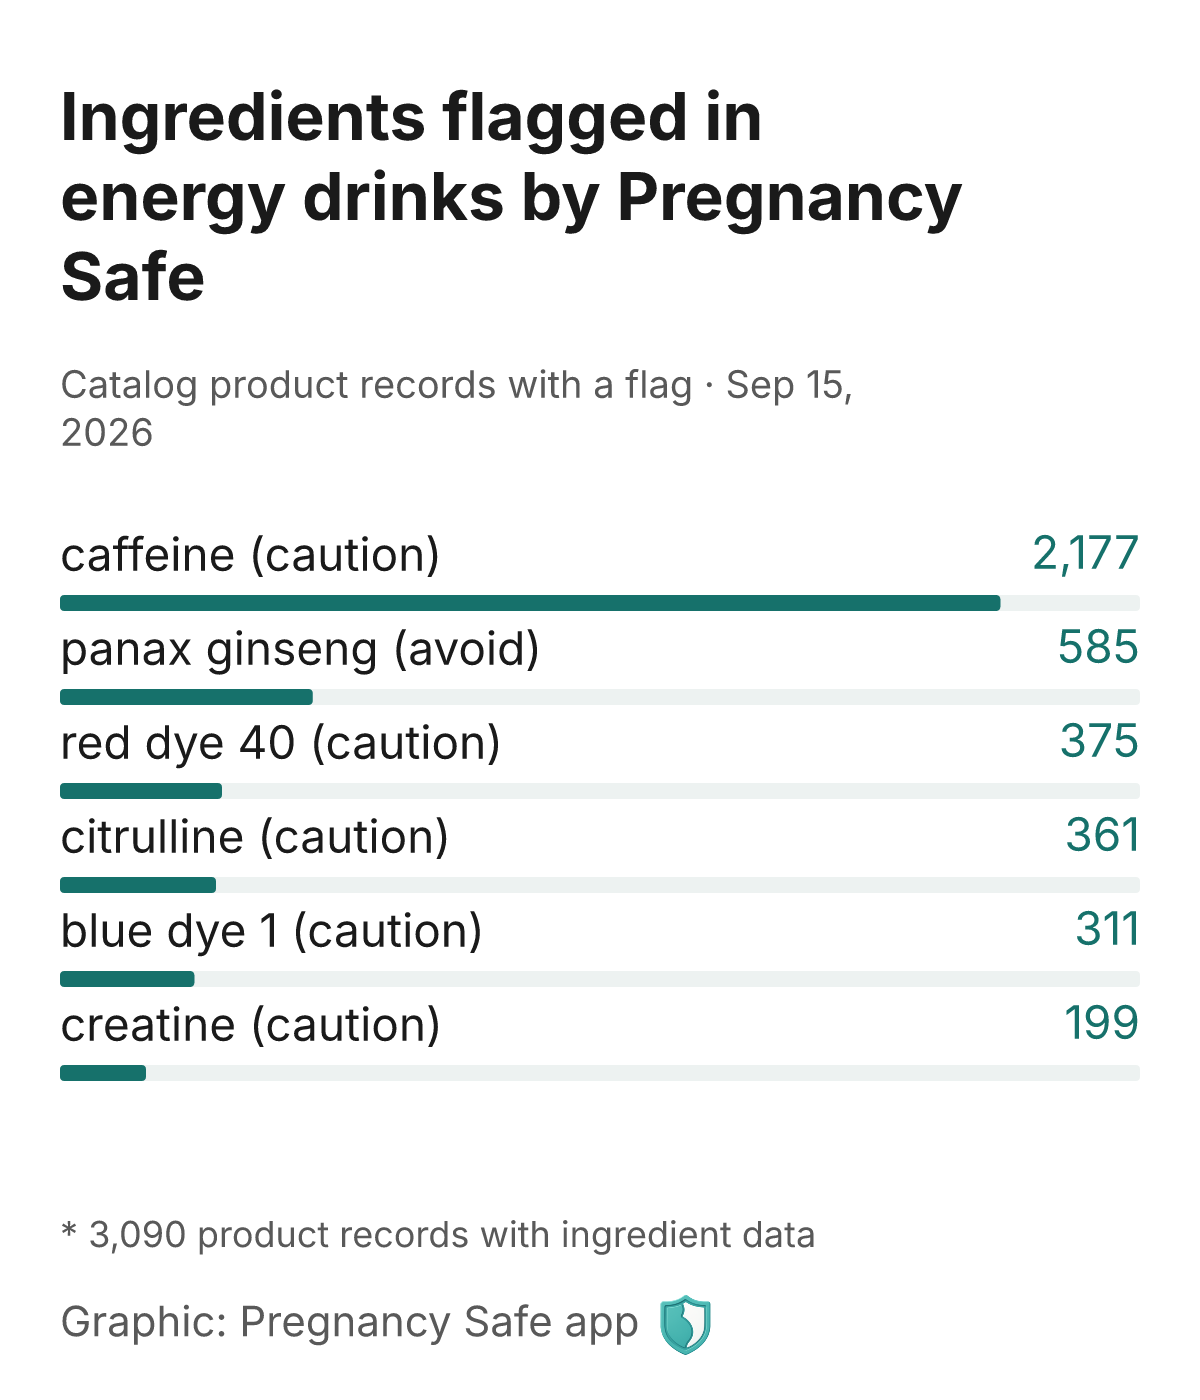
In Pregnancy Safe's catalog snapshot dated Sep 15, 2026, caffeine (caution) was flagged in 2,177 of 3,090 energy drink catalog product records with ingredient data. Flags reflect the app's context specific rules, not observed pregnancy outcomes.
Download imageIngredients flagged in herbal teas by Pregnancy Safe
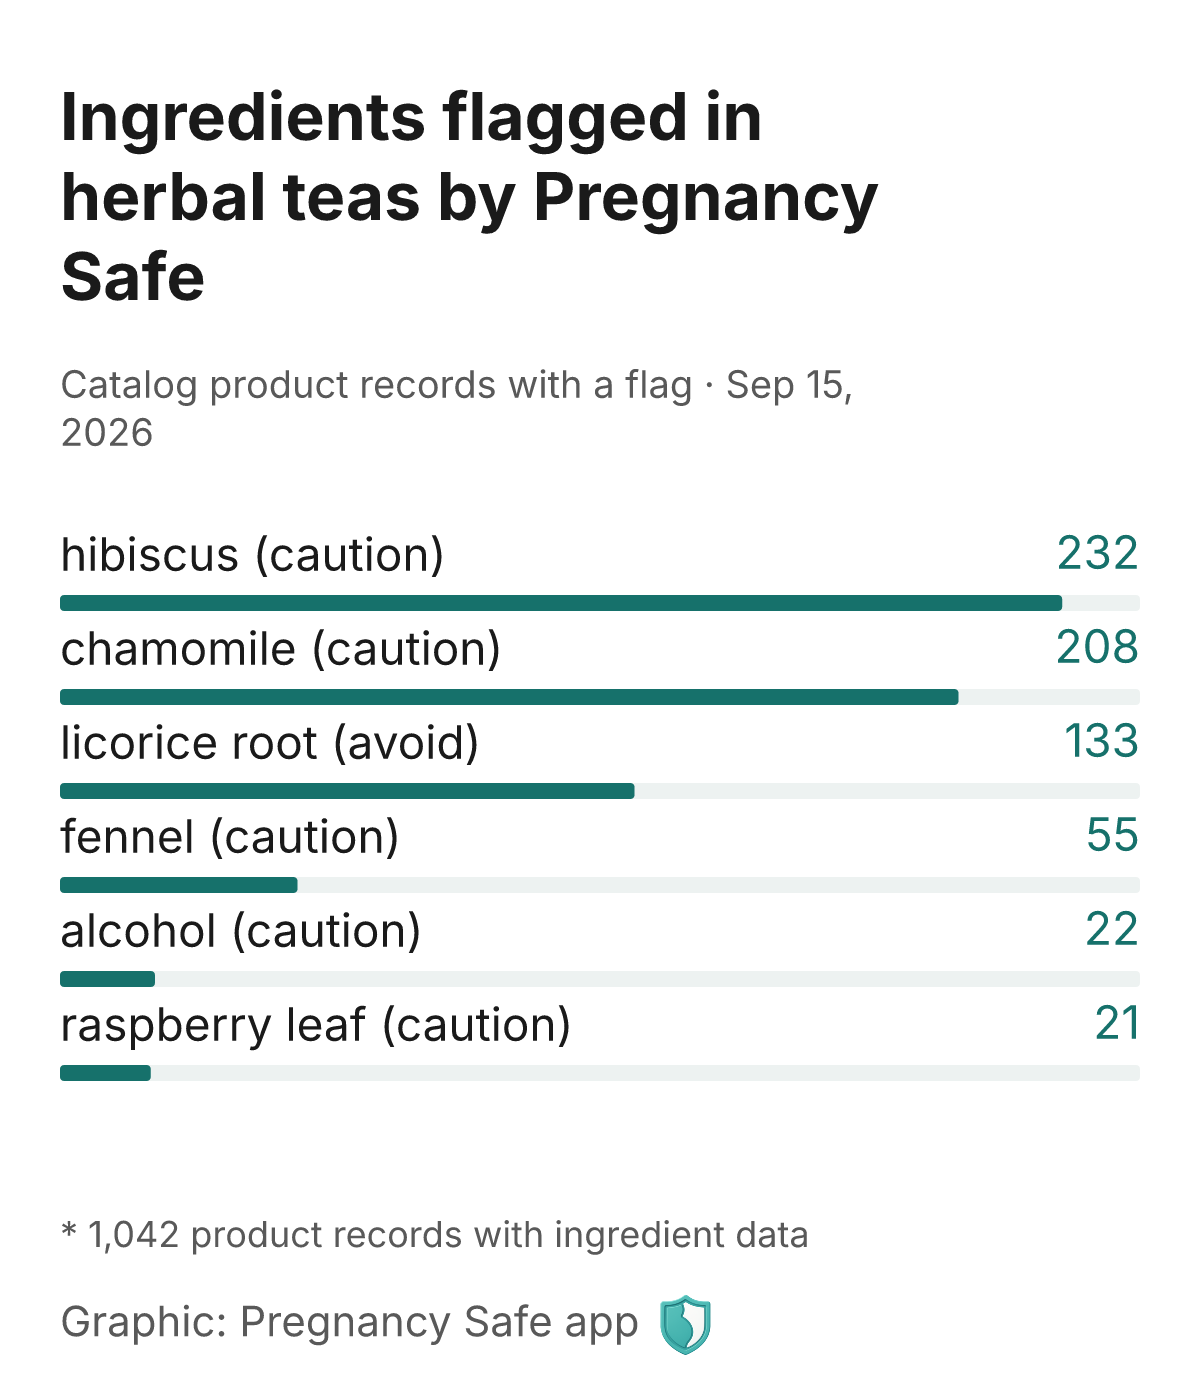
In Pregnancy Safe's catalog snapshot dated Sep 15, 2026, hibiscus (caution) was flagged in 232 of 1,042 herbal tea catalog product records with ingredient data. Flags reflect the app's context specific rules, not observed pregnancy outcomes.
Download imageIngredients flagged in protein drinks and powders by Pregnancy Safe
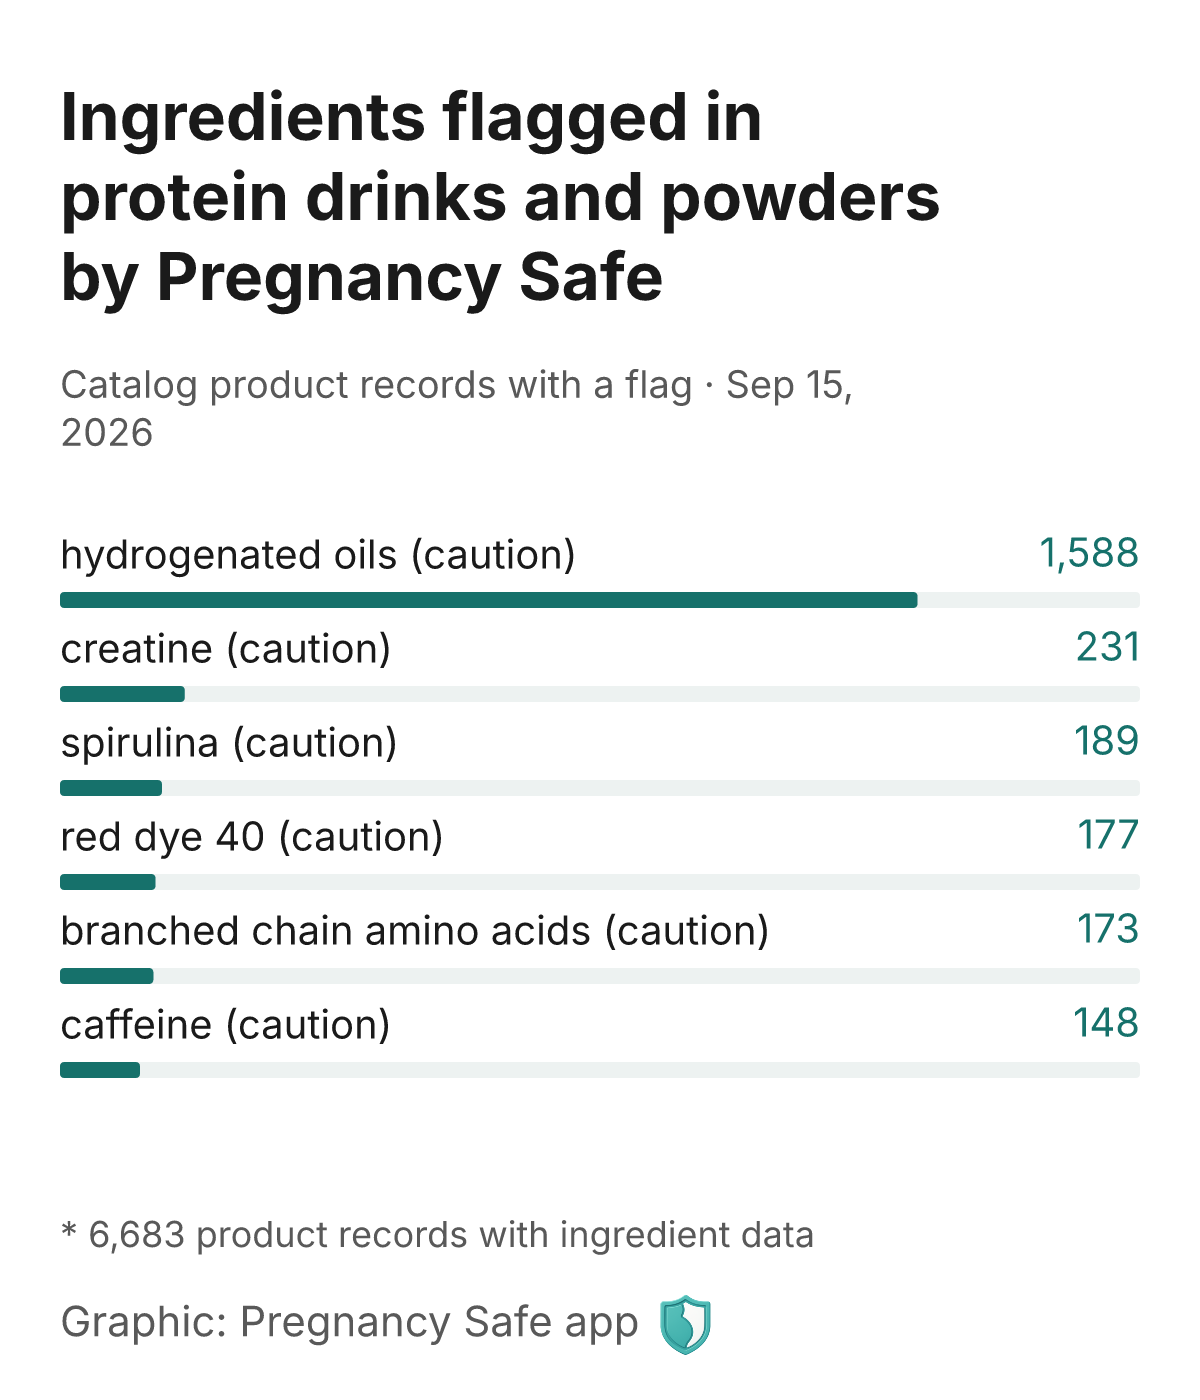
In Pregnancy Safe's catalog snapshot dated Sep 15, 2026, hydrogenated oils (caution) was flagged in 1,588 of 6,683 protein drink powder catalog product records with ingredient data. Flags reflect the app's context specific rules, not observed pregnancy outcomes.
Download imageIngredients flagged in supplements by Pregnancy Safe
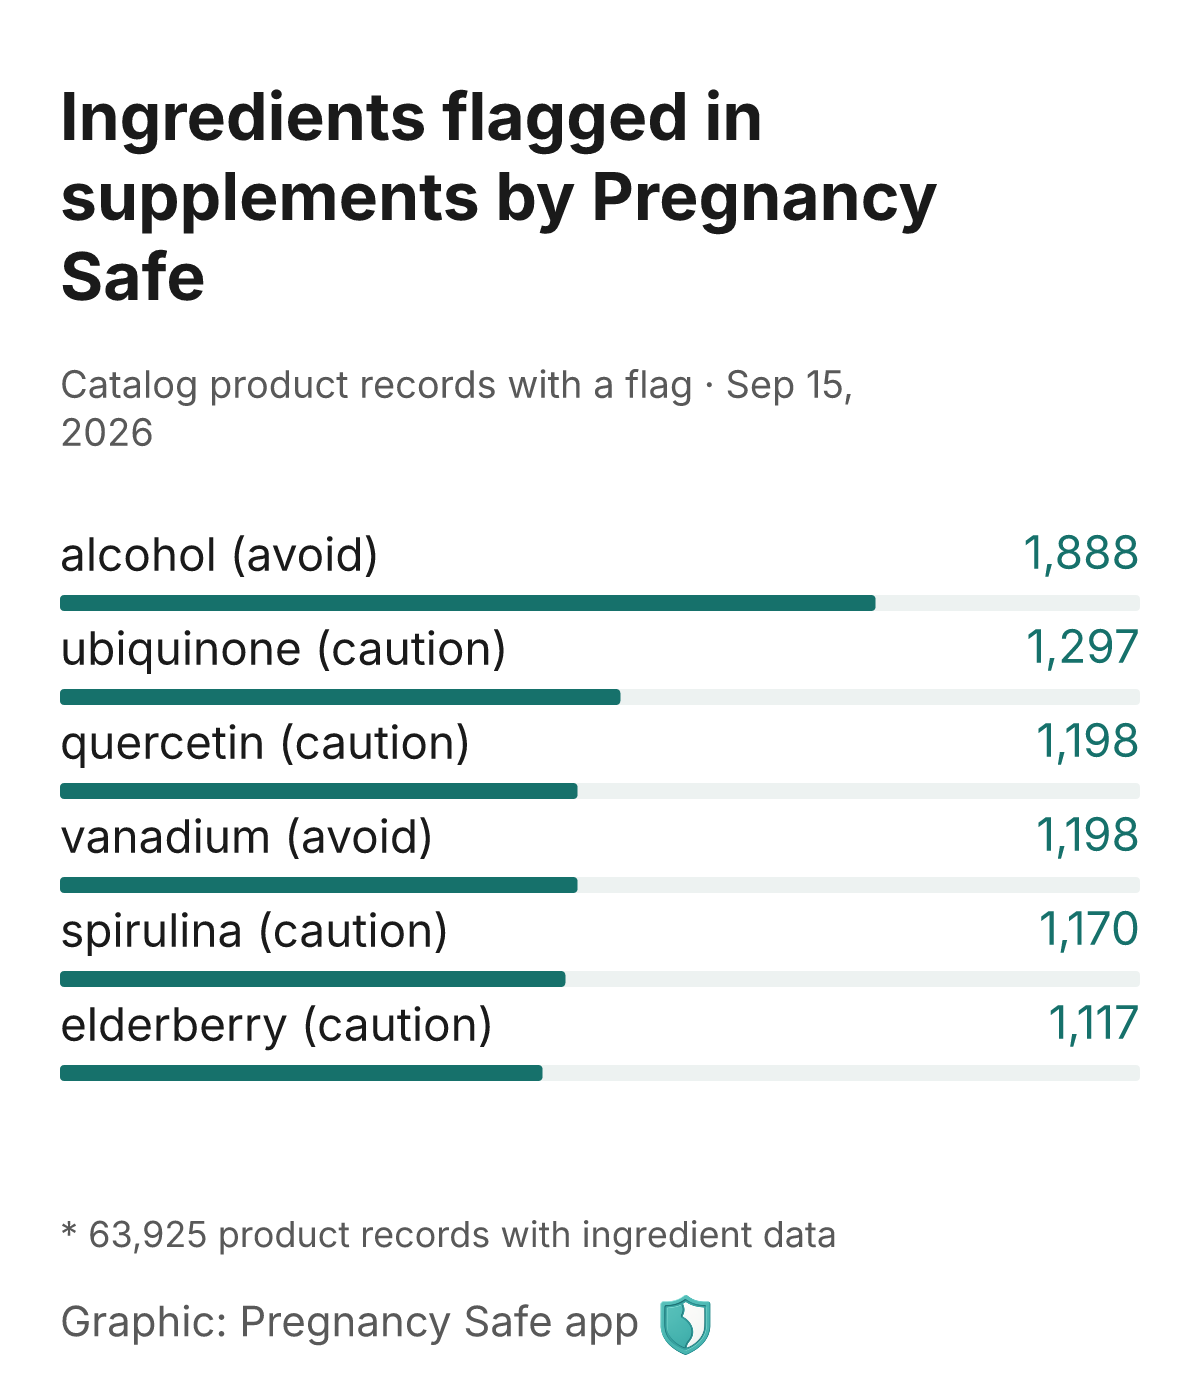
In Pregnancy Safe's catalog snapshot dated Sep 15, 2026, alcohol (avoid) was flagged in 1,888 of 63,925 supplement catalog product records with ingredient data. Flags reflect the app's context specific rules, not observed pregnancy outcomes.
Download imageIngredients flagged in skincare by Pregnancy Safe
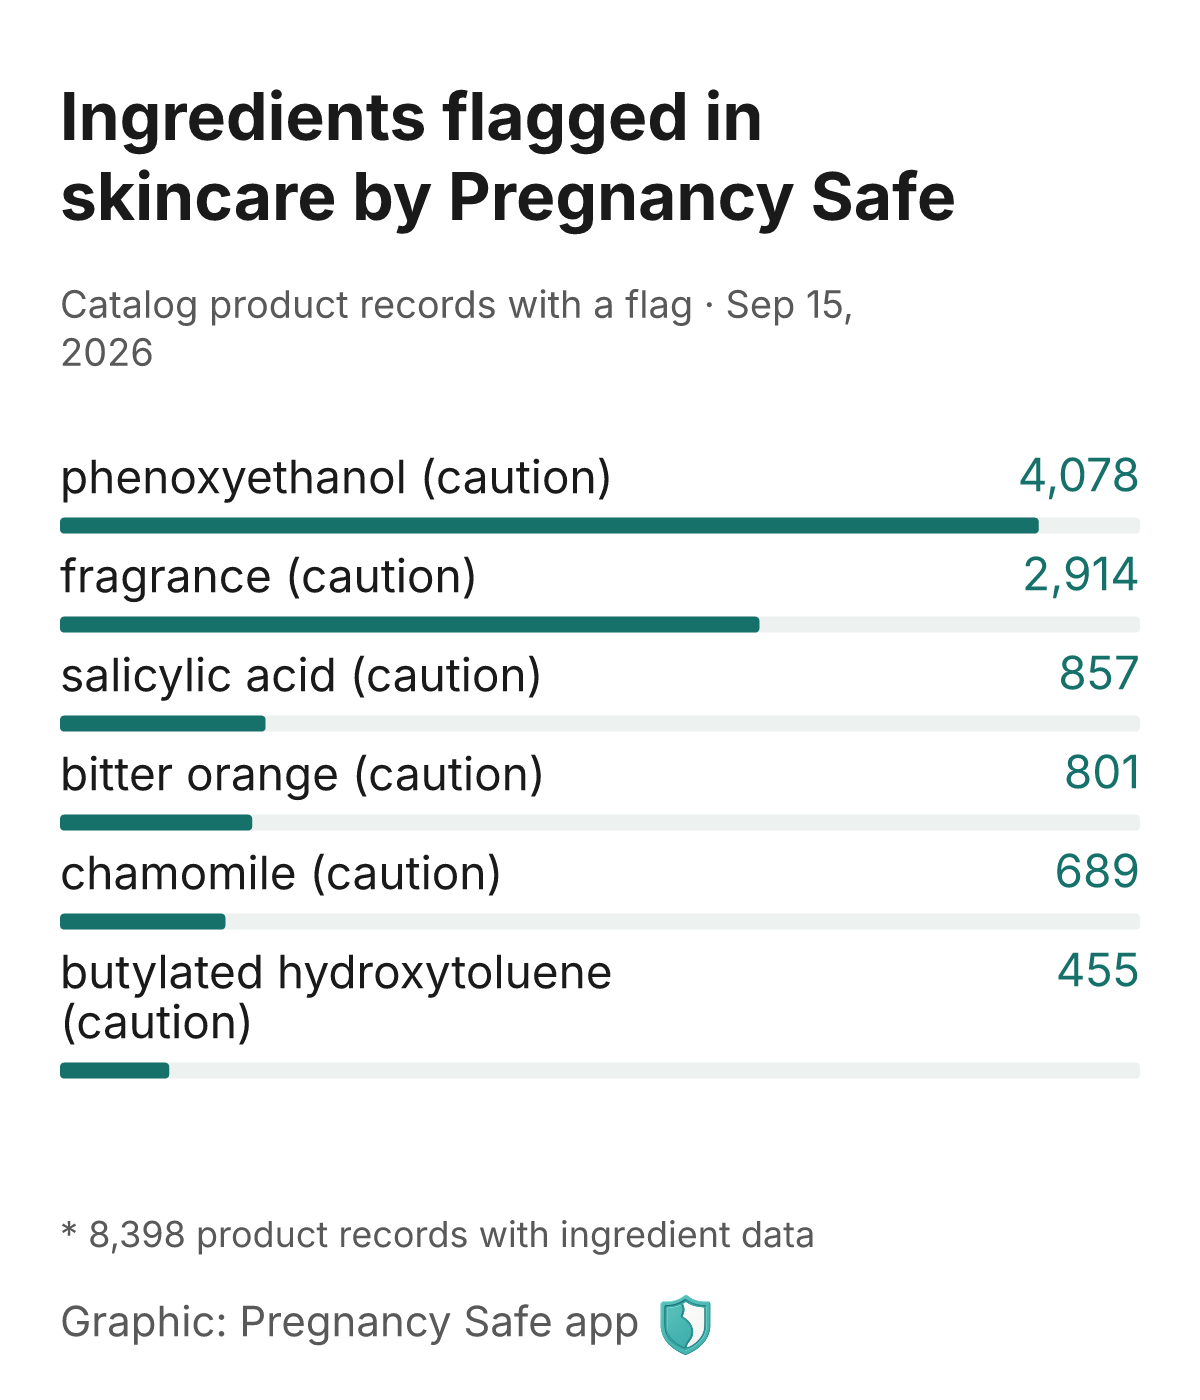
In Pregnancy Safe's catalog snapshot dated Sep 15, 2026, phenoxyethanol (caution) was flagged in 4,078 of 8,398 skincare catalog product records with ingredient data. Flags reflect the app's context specific rules, not observed pregnancy outcomes.
Download imageIngredients flagged in haircare by Pregnancy Safe
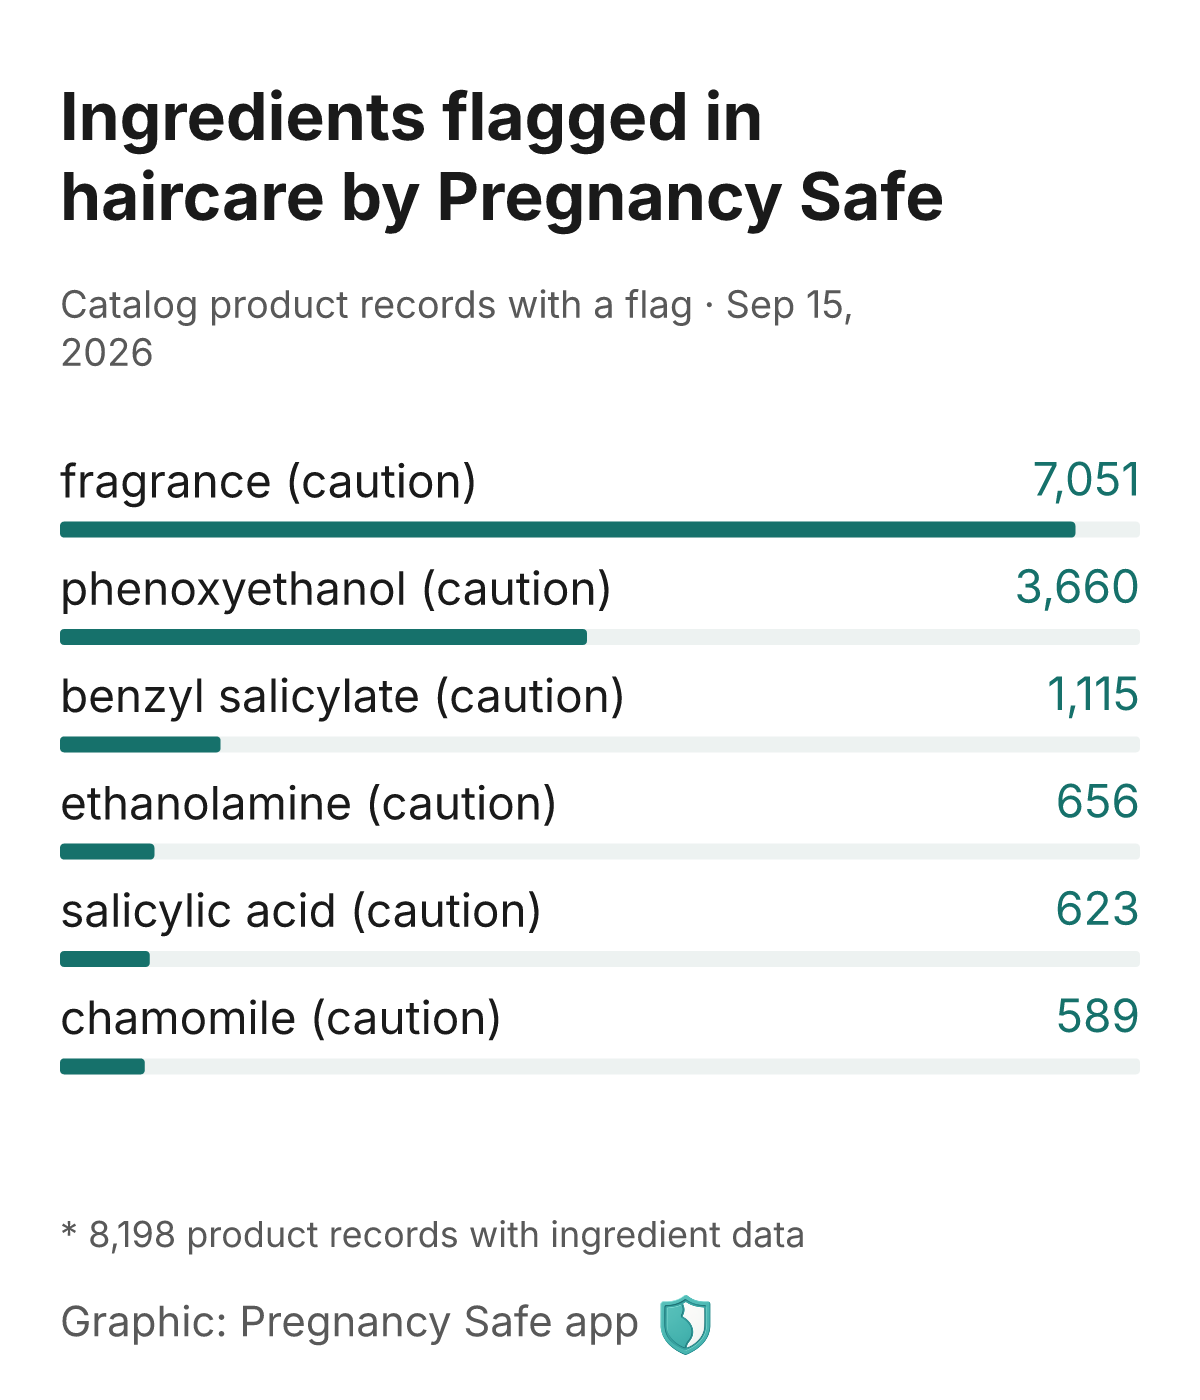
In Pregnancy Safe's catalog snapshot dated Sep 15, 2026, fragrance (caution) was flagged in 7,051 of 8,198 haircare catalog product records with ingredient data. Flags reflect the app's context specific rules, not observed pregnancy outcomes.
Download imageSources and methodology
Public statistics
Public findings are traced to their original publications. Each chart shows the data period, which may be earlier than this page's update date. Counts, rates, survey estimates and populations are not interchangeable. Source links beneath the charts lead to the original research.
Pregnancy Safe app research
Product checks are app events, not people, purchases or confirmed exposures. App users are not a representative sample of pregnant people in the United States. The current activity window covers January 1, 2026 through September 14, 2026. Category rankings include only checks that exactly match a catalog identity and an explicit category mapping. Unclassified activity remains in the denominator of overall category shares.
Symptom charts count distinct accounts reporting a symptom within each assigned week, divided by accounts with a check in that week. Multiple selections can overlap. Weeks are reconstructed from current profile due dates, not historical pregnancy records. Cells and complements below 30 accounts are suppressed, not treated as zero. These rules do not establish privacy approval or clinical prevalence.
Ingredient charts count distinct catalog product records with linked ingredients, not deduplicated formulations. The Pregnancy Safe scoring matcher resolves aliases and context specific caution or avoid flags. These are app classifications, not measurements of pregnancy outcomes or guarantees of safety.
Using the graphics
Download an image using the link beneath its quote. When citing public findings, name and link the original data source; credit Pregnancy Safe for the graphic. Image URLs stay the same when the associated data are updated. The period printed on the image identifies the data it shows.